A false breakout is a move through a support or resistance zone that closes back inside it. Price pushes through, cannot stay there, and the traders who acted on the break end up on the wrong side.
A false break above resistance is called a bull trap. A false break below support is called a bear trap.
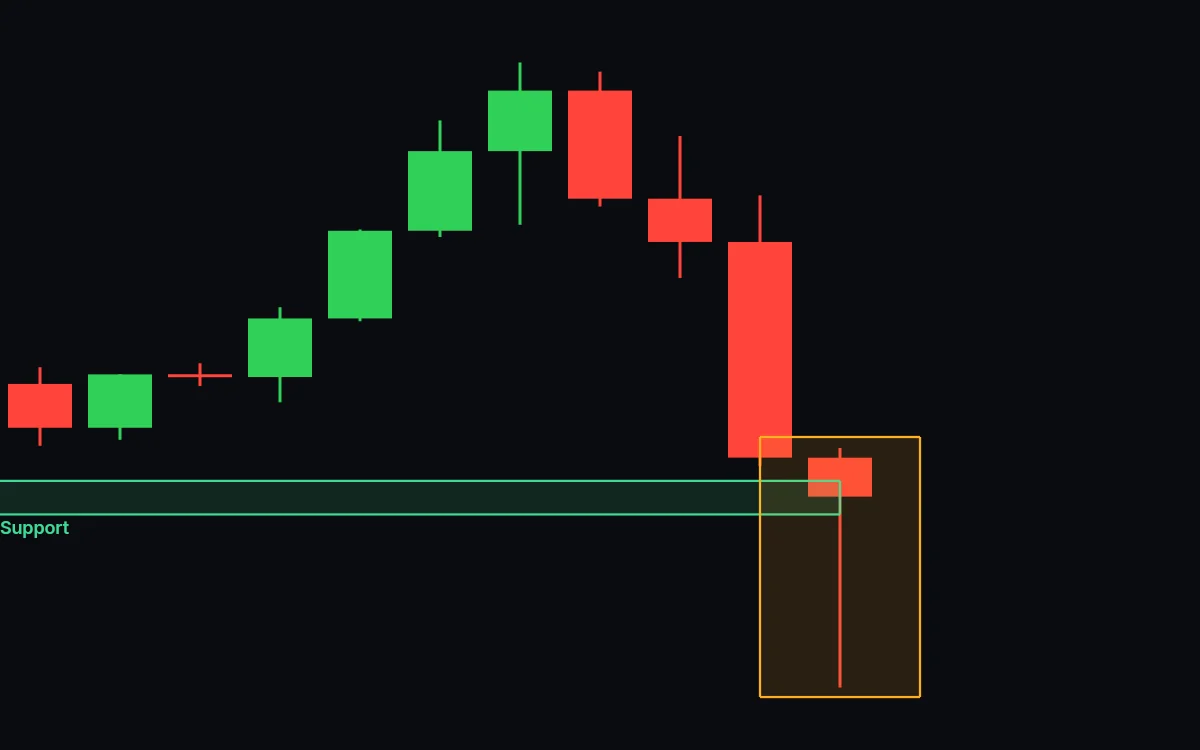
On the third chart of the free lesson on this page, price turns up from the same support three times. Then one candle crashes through the zone and ends the day back in it, and every trader who sold the break is short at the low.
What makes a breakout false?
The close. By the rule these lessons use, a break needs a candle to close beyond the zone. A candle that pierces the zone and closes back inside it is a false break, however far its wick reached.
| Real break | False break | |
|---|---|---|
| The candle's close | Beyond the zone | Back inside the zone |
| What usually follows | Price keeps going, or comes back to test the zone from the other side | Price returns into its old range |
| Who ends up wrong | Traders betting the level would hold | Traders betting on the break |
What are bull traps and bear traps?
A bull trap is a false breakout above resistance. A bear trap is one below support. Each is named after the traders it catches.
| Bull trap | Bear trap | |
|---|---|---|
| The false move | Up through resistance | Down through support |
| Who gets trapped | Buyers who bought the breakout | Sellers and short sellers who sold the breakdown |
| What price does next | Falls back below resistance | Climbs back above support |
The false break in the lesson is a bear trap. Traders who sold as price crashed through support were short as the zone held.
Why do false breakouts happen?
Stops fire in clusters. Many traders put their stop-loss orders beyond the same obvious zone, and when price reaches them they all fire at once.
Osler studied this in currency markets for the Federal Reserve Bank of New York. Her 2002 staff report found that stop-loss orders "contribute to rapid, self-reinforcing price movements, or 'price cascades.'" Exchange rate trends were "unusually rapid when rates reach exchange rate levels at which stop-loss order have been documented to cluster."
A wave of triggered stops can carry price through a zone in seconds. Once those orders are filled, nothing is left pushing, and price can drift straight back inside.
Which support and resistance levels matter most?
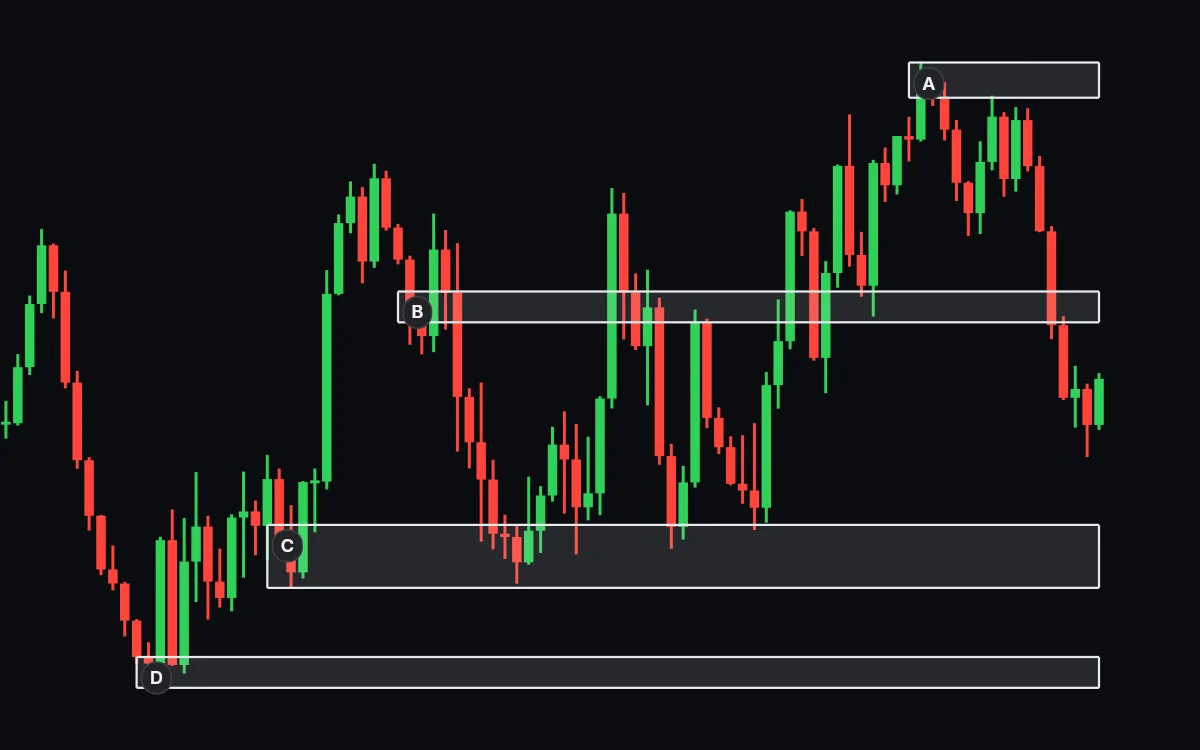
The ones with four marks: a clear turn, a fast move away, more than one turn, and recent price action. The lesson starts with four zones on one chart and asks which one has all four.
| Zone | What price did there | All four? |
|---|---|---|
| A, the highest turn | Turned once | No |
| B, the middle of the range | Crossed it back and forth without turning | No |
| C, the lower zone | Turned up more than once, fast, recently | Yes |
| D, the lowest turn | Turned once | No |
Take the other three away and price comes back to C and turns up again.
Do strong levels still fail?
Yes, regularly. On the lesson's second chart you draw the support zone with no help.
Price climbs away, comes back, dips into the zone a few times, and then a candle closes below it.
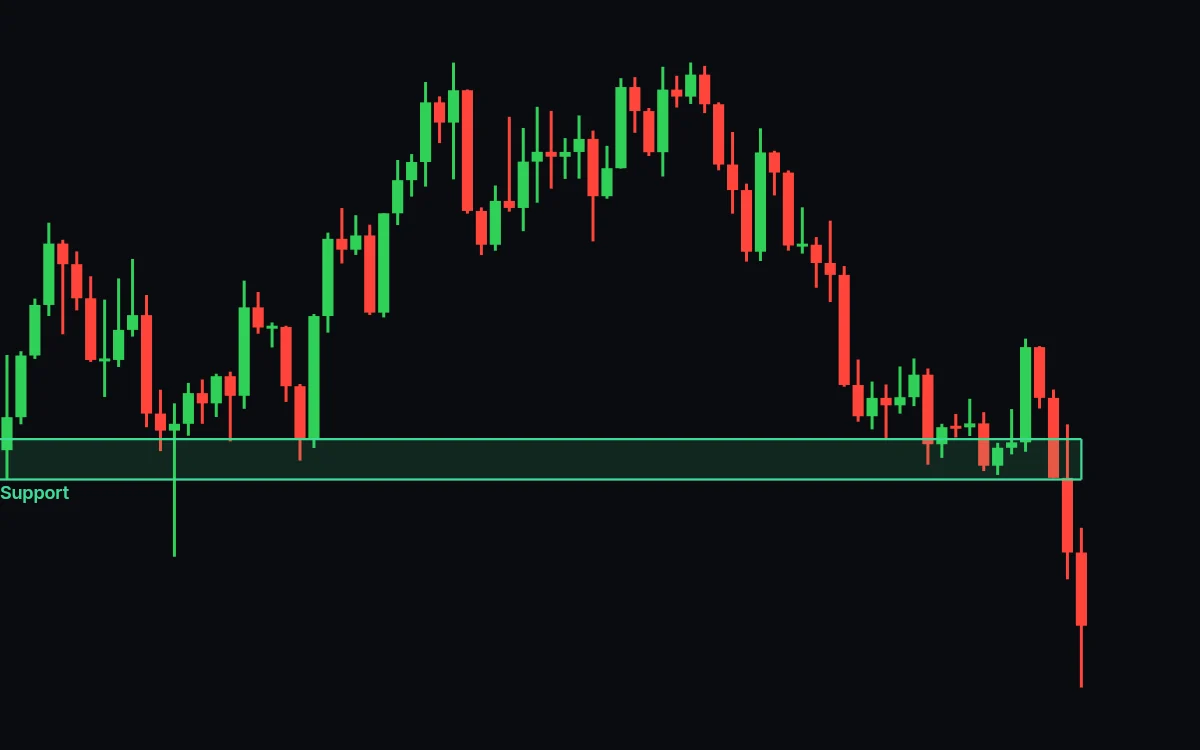
You cannot tell ahead of time which levels will fail. Even levels with all four marks break, and in the one careful test of published levels about four touches in ten did not bounce (support and resistance trading has the study).
How do traders deal with false breakouts?
Wait for the close, put the stop beyond the whole zone, and size the trade for the loss.
None of the three tells a real break from a false one as it happens. They cap what a wrong call costs.
A wick through the zone is not a break until a candle closes beyond it.
A stop at the edge of the zone is where the stop-loss wave hits first. Give it room beyond the whole zone.
Then size the trade for the loss, which is what a position size calculator does. Say you risk $100 per trade. With a stop $0.50 away you can trade 200 shares. Widen it to $1.00 and you trade 100, so the loss stays $100.
Key points
- A false breakout pushes through a zone and closes back inside it.
- Above resistance it is a bull trap. Below support it is a bear trap.
- Stop-loss orders clustered past a level can drive a fast move through it that does not last.
- Pick levels with a clear turn, a fast move away, more than one turn and recent action. Levels still fail.
Press Start above and try to spot the false break before the chart shows it. Then practice on a chart that plays candle by candle in the free day trading simulator.