Trading articles
Free articles on chart reading, risk and trading psychology.
Best Free Day Trading Simulators of 2026, Compared
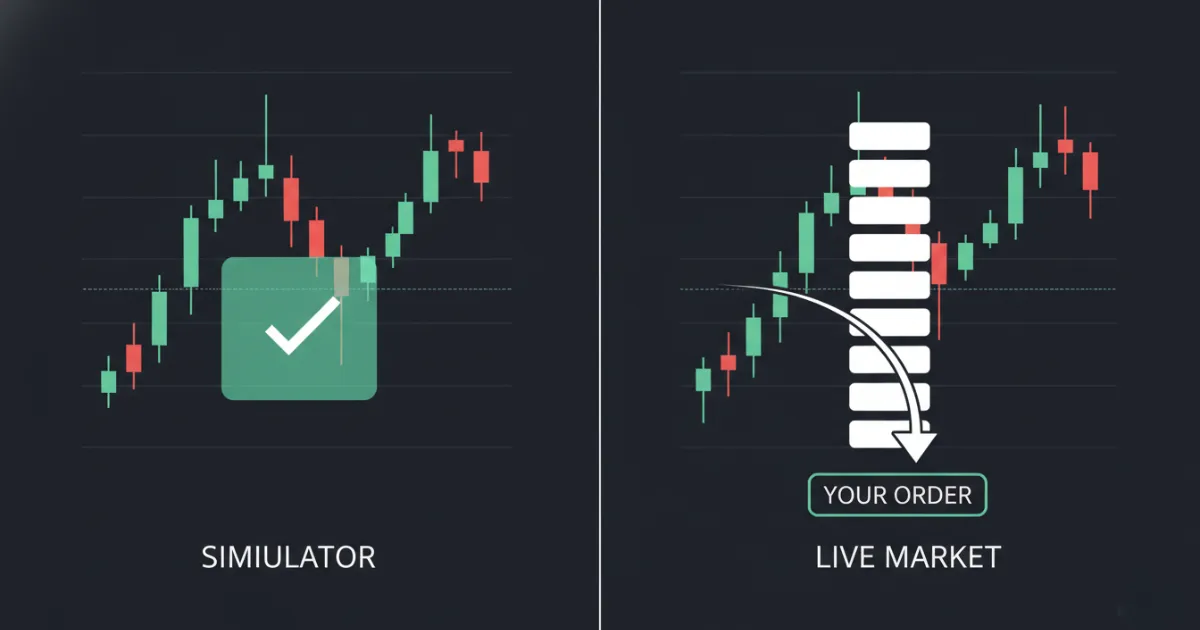
Six free day trading simulators compared on fill realism, data delay and order support. Simulated engines fill at top-of-book the moment price touches, ignoring queue priority and market impact, which is why the paper account beats the live one.
Daily Loss Limit: How to Set One and Stick to It
A daily loss limit caps what one session can cost you, set the night before and never renegotiated while the market is open. How to size it at 1 to 3% of the account, the stricter loss-from-top variant, and what to do the moment you hit it.
Risk of Ruin in Trading: The Formula and Your Numbers
Risk of ruin is the probability an account falls to the drawdown where continuing stops being realistic, usually 20 to 30%. Kaufman's formula, why drawdown compounds against recovery, and why 1 to 2% per trade puts ruin near zero.
Expectancy in Trading: The Math Behind Your Edge
Expectancy is the average a trade returns across a large sample, and it is the number a win rate cannot replace. The formula, how to calculate it in R-multiples, what a good figure looks like, and how the disposition effect erases it.
How to Set a Stop Loss That Sizes the Trade for You
Start from the price that proves the trade wrong, then size the position around that distance. Where to place a stop using market structure rather than a fixed percentage, when a stop-limit order leaves you unfilled, and a workflow to repeat.
Day Trading: Risks, Profits, and Requirements
What the research says about day trading profitability, why most intraday traders lose money, and what starting actually requires now that the Pattern Day Trader rule's $25,000 minimum was removed in April 2026.
Stock Market Basics: A Beginner's Guide
What the stock market is, how a price gets set between a buyer and a seller, and what owning a share of a business actually entitles you to. Bull and bear markets, where the money actually comes from, and what beginners get wrong first.
How Many Shares Should You Buy? Risk-Based Formula
Share count is a formula output, not a guess: account size times risk percent, divided by the distance from entry to stop. A worked example at 1 to 2% risk, what sizing too large costs in drawdown, and the mistakes that break it.
Day Trading Strategies for Beginners: Two That Work
Momentum trading and the opening range breakout, the two most beginner-accessible day trading strategies, with entry conditions, stop placement and targets. Research finds 74% of day trading volume comes from traders with a losing history.
Best Stock Trading Simulators of 2026, Free and Compared
Stock trading simulators compared on data quality, order types and what each one costs to run. Covers the free picks for students and classrooms, and the one gap no simulator closes: the emotional pressure of a funded account.
The Kelly Criterion: How to Size Positions
The Kelly Criterion returns the position size that grows an account fastest, from your win rate and average win to loss ratio. The formula, why full Kelly wrecks accounts before the edge proves itself, and why most traders run a fraction of it.
Martingale Strategy in Trading: Does It Work?
Doubling position size after every loss until one win covers them all. On a $25,000 account at 1% risk, seven straight losses end it, and seven-loss streaks are routine. Why stocks are worse than a roulette wheel, and what to use instead.
What Is a Trading Journal? What to Log and How to Review
A trading journal records every trade and the reasoning behind it, which is what separates it from a trade log. What to capture on each entry, how to run the review that makes it worth keeping, and whether a spreadsheet is enough.
What Is Overtrading? Signs, Causes and How to Stop
Overtrading is taking trades that do not meet your criteria, not simply taking a lot of them. Why boredom and emotion produce the extra entries, what they cost in fees and drawdown, the signs to watch for, and how to cut them out.
Why Most Beginners Lose Money Trading
Studies put the share of retail traders losing money between 74% and 89%, most of them inside the first year. The five mistakes that produce it, in the order beginners make them, starting with real money before a written process exists.
What Is Trading Volume? How to Read It on a Chart
Trading volume is the number of shares that change hands in a period, and it tells you whether a price move had real participation behind it. How volume grades a breakout, how it shifts through the session, and when it misleads.
What Is a Stock Chart? How to Read Price and Volume
A stock chart is a record of where price has been and how much activity came with it. What each number represents, the three chart types traders actually use, how the timeframe changes the story, and how to read volume under the candles.
What Is a Candlestick Pattern? How to Read One
A candlestick pattern is a shape formed by one or more candles showing who controlled the session and where they lost it. What a single candle tells you, the patterns traders meet most, why context decides the reading, and whether they work.
What Is Paper Trading? How a Demo Account Really Fills
Paper trading is practicing with virtual money on real prices, opening and closing positions exactly as you would live. How a demo account fills an order, what the practice genuinely teaches, and where simulated results stop matching real ones.