Support becomes resistance when price closes below a support zone and later climbs back up to it. Traders call it a role reversal.
Traders who bought at the old support are now losing money, and many sell as soon as price returns to their entry. That selling can turn the old floor into a ceiling.
In the lesson, one trader buys at $50.00 on support, watches the stock reach $58.50, holds through a break to $43.50, then sells at $50.00 for nothing and calls it a relief.
It works in reverse too: broken resistance can become support. The free lesson on this page walks you through both on two charts and has you call each one before the chart plays on.
What counts as a break?
A break is a candle that closes beyond the zone. That is the most common rule, and the one these lessons use, with zones drawn the way lesson 1 draws them.
A wick that pokes through the zone and closes back inside it is not a break. A burst of orders can push price through a level and reverse within the same candle. The close shows where price settled.
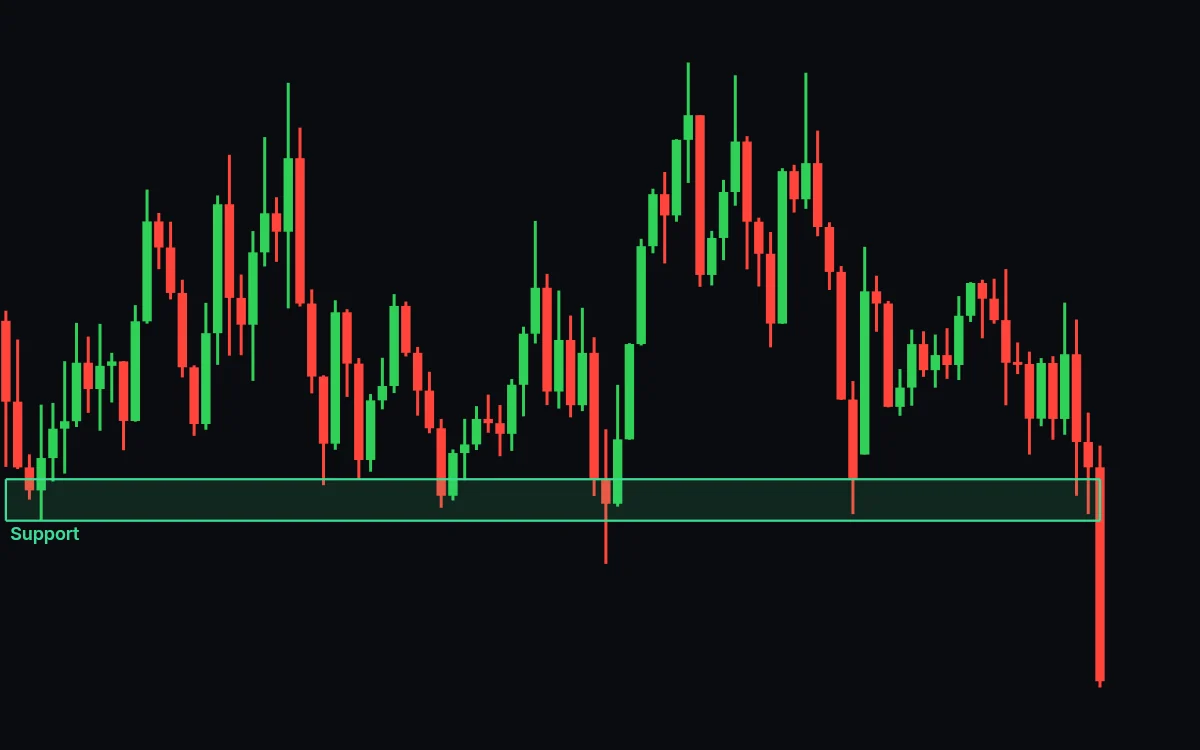
The lesson asks you to pick which of two candles broke the level.
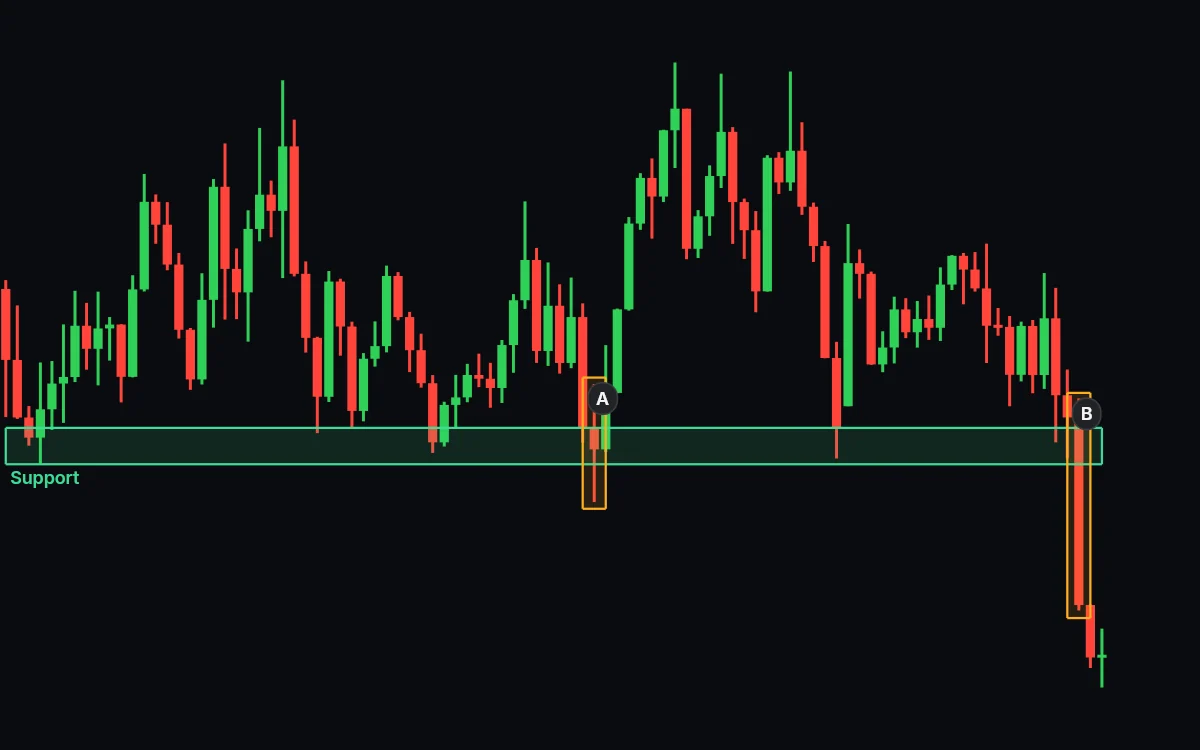
| Candle | What it did | Break? |
|---|---|---|
| A | Went below the zone, closed back inside it | No |
| B | Closed below the zone | Yes |
Why does broken support turn into resistance?
Trapped buyers. The traders who bought at the old support are holding a loss, and many of them sell the moment price gets back to their entry.
Follow one of them through the lesson's first chart. Call him John. Say John buys 100 shares at $50.00 on the third bounce off support, expecting it to hold again.
Price climbs to the old high, a resistance zone, and John is up 17%: $58.50 a share, $850 on paper.
Some traders take profit at a zone like that. John wants more and holds.
The zone holds and price falls away. Then a candle closes below John's support. At $43.50 he is down 13%, a $650 loss, and he does not want to take it.
He decides to wait until price comes back to $50.00.
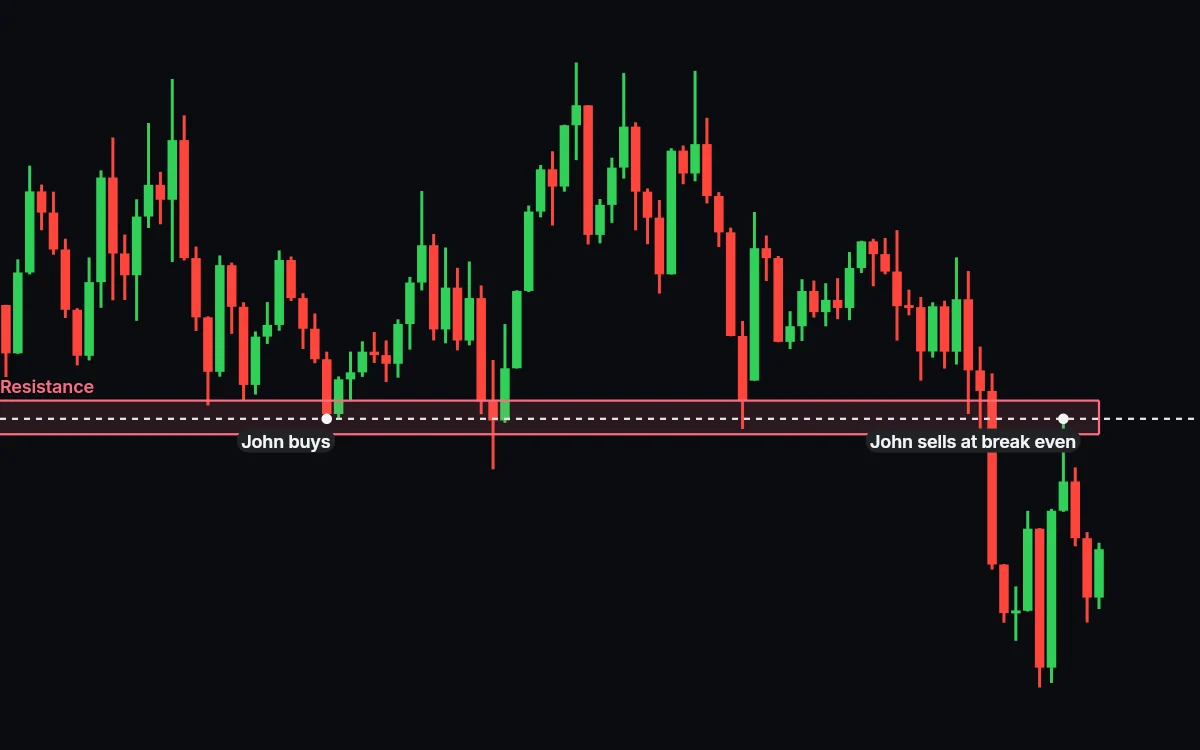
Price does come back. John sells at $50.00 for nothing, and he is relieved to get out. Plenty of traders with the same entry sell at the same price.
Does support always turn into resistance?
No. A retest of broken support goes one of three ways, and the flip is only one of them.
| After the break | What it looks like |
|---|---|
| The flip | Price returns to the zone and turns down from it |
| Straight through | Price returns and climbs back above the zone as if it were not there |
| No retest | Price keeps falling and never comes back to the zone |
Can resistance become support?
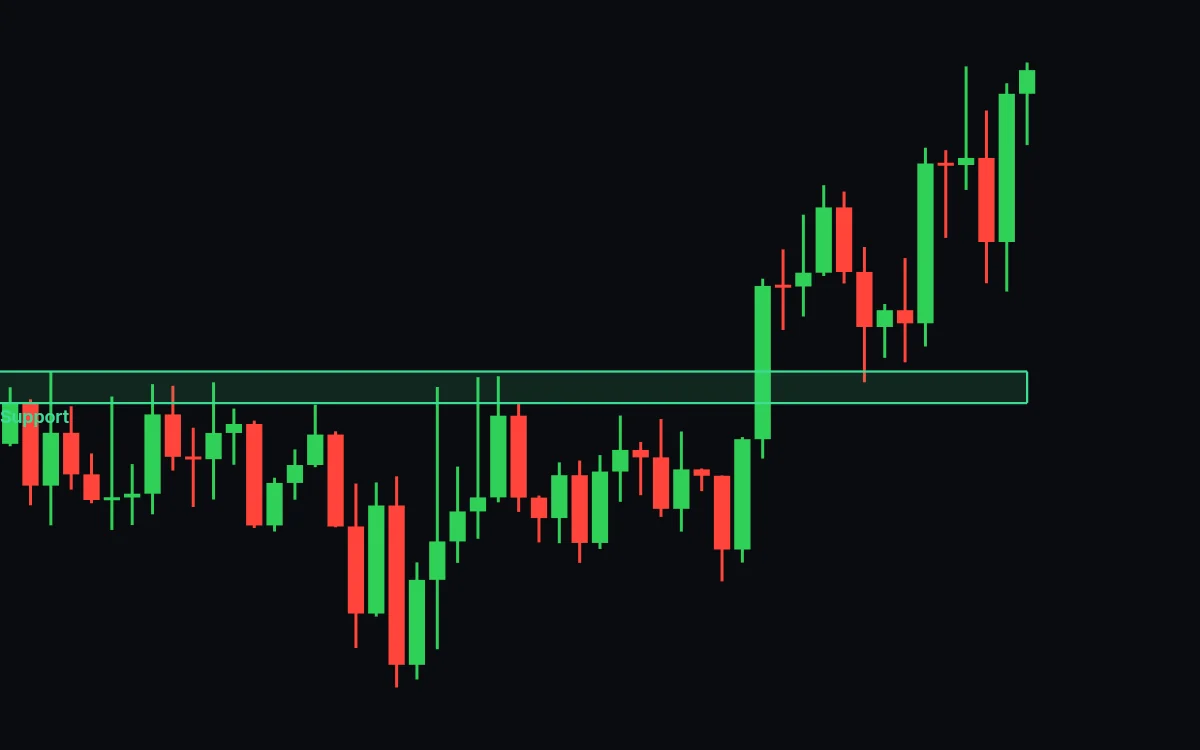
Yes, by the same logic upside down. Traders who sold short at resistance are losing once price closes above it.
Some buy back when price returns to their entry, and that buying can hold price up.
On the lesson's second chart a candle closes well above resistance. Price then pulls back into the zone from above and turns up.
How do traders trade the flip?
They wait for price to come back to the zone and act only if it turns away from the new side. The break itself is the riskier entry, because it can still turn into a false break.
The stop goes on the far side of the zone. If a candle closes back through it, the flip did not happen and the trade idea is wrong.
Not every break gets a retest. Waiting for one means sometimes missing the move.
Key points
- A break needs a candle to close beyond the zone. A wick through it is not enough.
- Traders who bought at broken support often sell when price returns to their entry. That selling can turn support into resistance.
- Broken resistance can become support in the same way.
- The flip is one of three outcomes. Price often goes straight through.
Press Start above and call the flip yourself. A break can also reverse within a candle or two, and lesson 3 shows you how to spot that false break.