To read a candlestick, look at three things: its color, the size of its body and the length of its wicks. Those three give the main candlestick types.
On a big-body day, one side moved the price a long way from open to close. On a small-body day, neither side got far. A long wick is a push the other side reversed.
Each candle is one period of price. On a daily chart it is one day.
The free lesson on this page has you read daily candles on two charts. You mark where a day closed, pick the day buyers won by the most and call the day after a long upper wick.
The charts are generated, with no ticker and no dates. The candles are all you get.
What does a candlestick show?
A candlestick packs four prices into one shape: the open, the high, the low and the close.
| Part | What it shows |
|---|---|
| Body | The open to the close |
| Upper wick | The body's top to the day's high |
| Lower wick | The body's bottom to the day's low |
| Color | Green closed above its open, red closed below |
On a green candle the open is the bottom of the body and the close is the top. On a red candle it runs the other way.
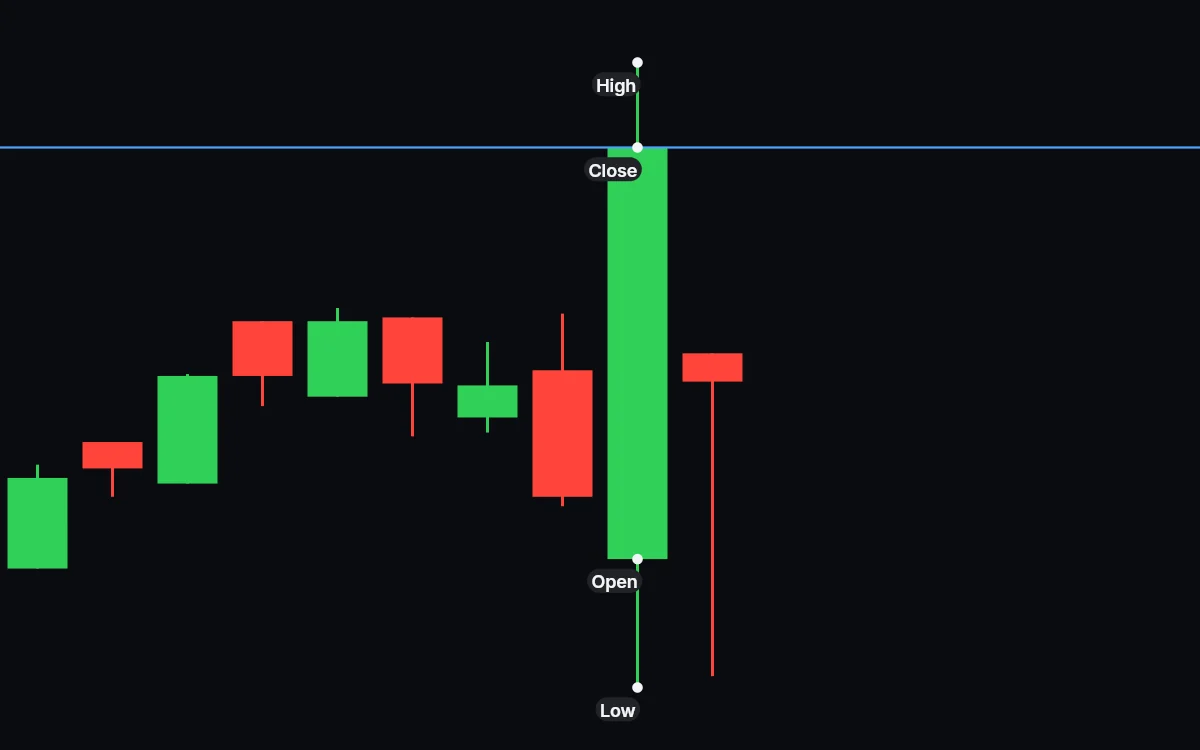
The open is not always the last close. Stock prices can move overnight, while the market is closed, so a day can open a little above or below where the day before ended.
That small step between two candles is a gap.
The lesson takes one day apart to show where the four prices come from. It cuts the day into 32 candles of 15 minutes each and ties the daily candle's open, high, low and close to the quarter hour each one happened in.
On that day the dip came early. The climb took most of the day. The close came near the high.
Where did the day close?
The close says who finished the day in control. Read it against the day's whole range, from the low to the high.
| Close | What it says about the day |
|---|---|
| Near the high | Buyers pushed the price up and kept it there |
| In the middle | Neither side held its gains into the close |
| Near the low | Sellers pushed the price down and kept it there |
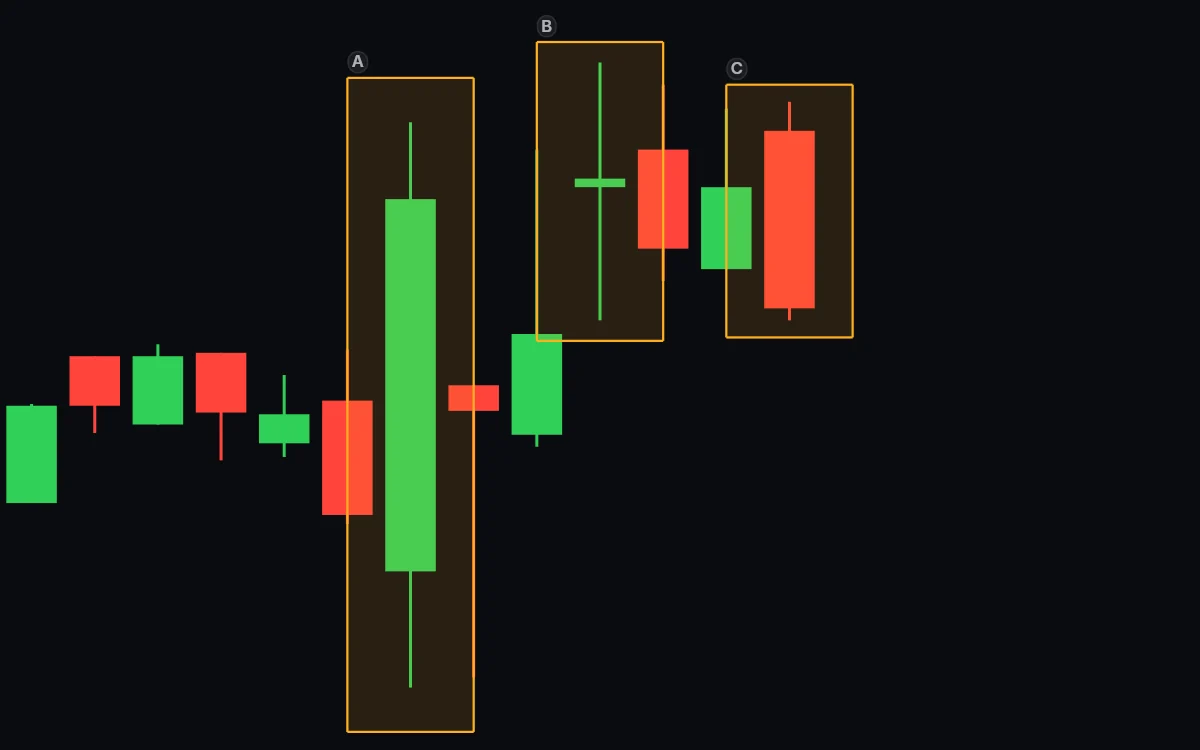
Candle A is the one the lesson counts as the clearest win for buyers. It closed right under its high.
What does a long wick mean?
A long wick is a price the day reached and could not hold. On top, buyers took the price up and sellers pushed it back down. Below the body, sellers took it down and buyers pushed it back up.
Color alone can mislead. A green candle with a tall wick on top still closed above its open. Most of what buyers gained during the day was gone by the close.
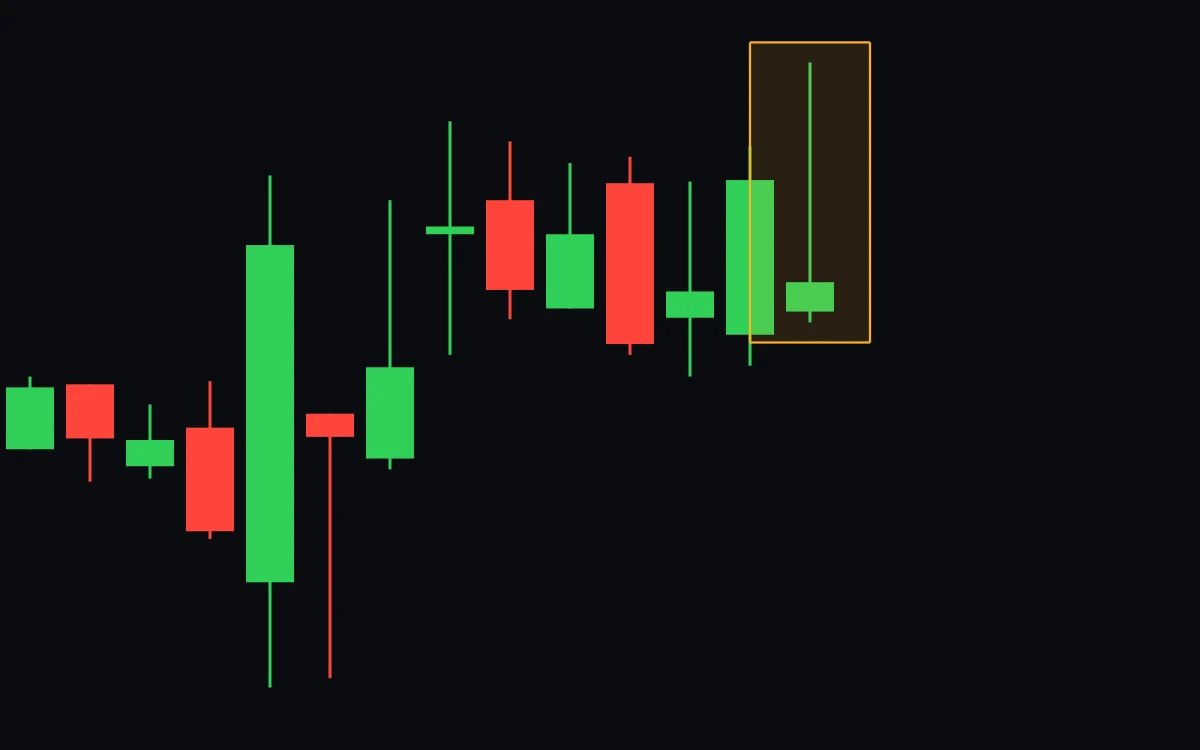
The wicks also tell you how far the price traveled. In 1980 Michael Parkinson showed in the Journal of Business that a period's high and low estimate how much a price swings about as well as five times as many closing prices, under his model's assumptions. A chart of closes throws that information away.
What are the main candlestick types?
Most named candles are one of five shapes. The name often depends on where the candle forms.
| Type | Shape | What it says about the day |
|---|---|---|
| Big body | A long body, short wicks | One side moved the price a long way from open to close |
| Small body | A short body, wicks on both sides | Neither side got far |
| Doji | A body no more than a tenth of the day's range | The day closed about where it opened. Neither side won |
| Hammer, hanging man | A long lower wick at least twice the body, little upper wick | Sellers pushed down, buyers pushed back. After a fall it is a hammer, after a rise a hanging man |
| Shooting star, inverted hammer | A long upper wick at least twice the body, little lower wick | Buyers pushed up, sellers pushed back. After a rise it is a shooting star, after a fall an inverted hammer |
The twice-the-body test for a hammer goes back to Steve Nison, whose 1991 book Japanese Candlestick Charting Techniques brought candlestick charts to Western traders.
What do shrinking bodies tell you?
They tell you the side in control is pushing less hard. The lesson's second chart rises on big green bodies, one day after another. Near the top the bodies get smaller.
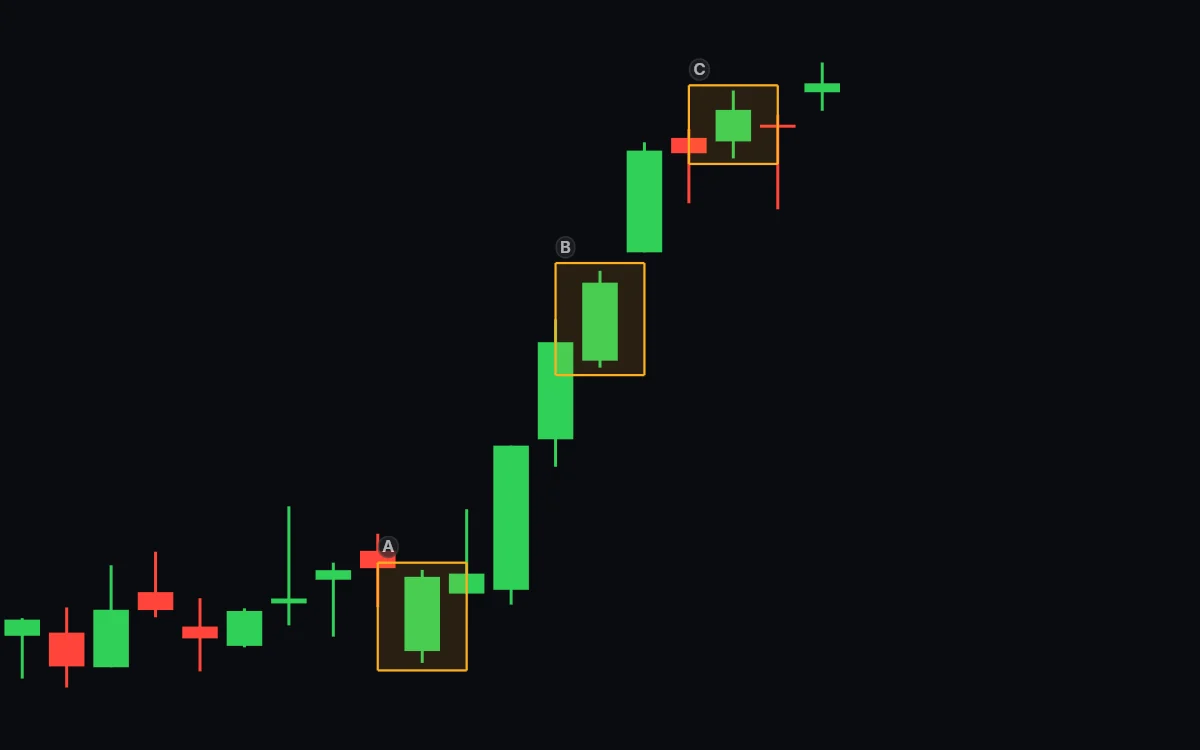
Buyers still won those days, by less each time. Then a day prints a tall wick on top: buyers tried to go higher and sellers pushed them back. The lesson asks which way the price goes next.
It turned down.
The last candle of the lesson ends a fall. Sellers dragged the price far down during the day, then buyers pushed it almost all the way back up.
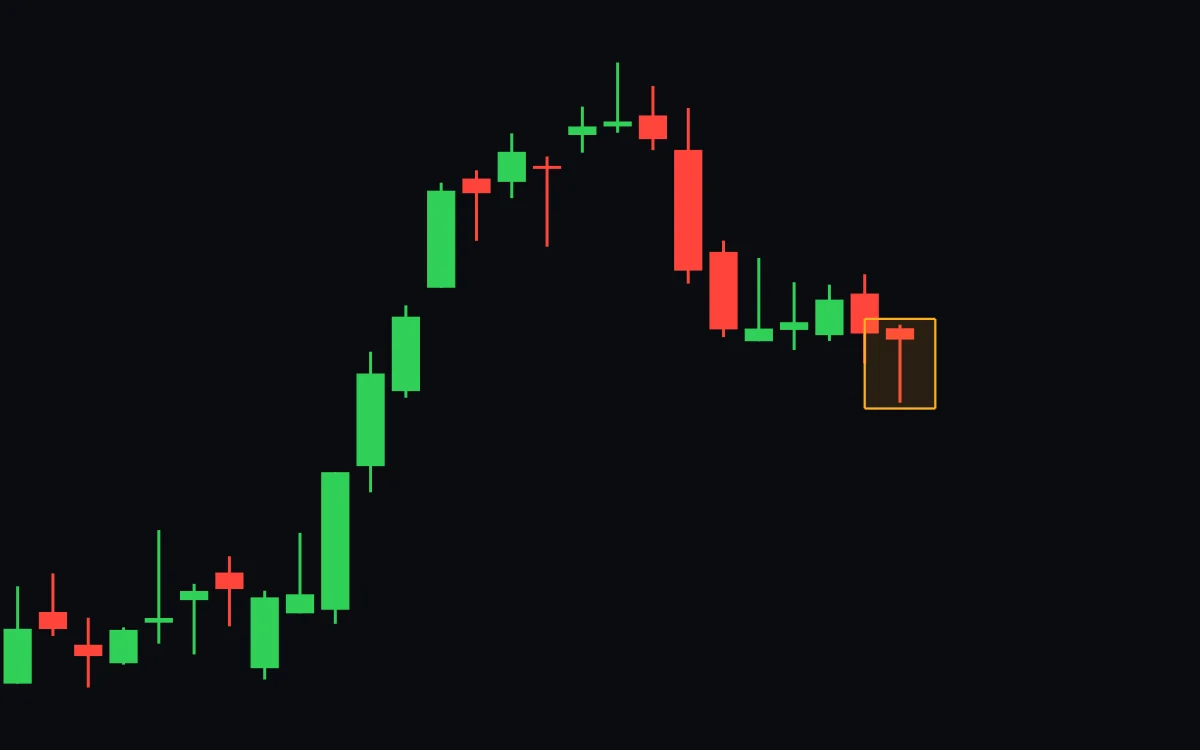
A long lower wick like that, after a fall, is called a hammer.
Can one candle tell you what comes next?
No. A candle records a day that is over. The next day can go the other way.
Traders read a candle together with where it formed: after a long rise, after a fall, or at a price where the chart turned before. Some read it with the day after, as in an engulfing candle, which wipes out the whole body of the day before. The candlestick patterns page lists the shapes traders gave names to and where they look for each one.
Key points
- A candle shows one day's open, high, low and close. The body runs from the open to the close, the wicks to the high and low.
- Where the close sits in the day's range says who finished in control.
- A long wick is a price the day reached and gave back.
- Big body, small body, doji, long lower wick, long upper wick: most named candles are one of these, named by where they form.
Press Start above and mark where the first day closed. The next lesson, the doji candle, is the day neither side won.