An engulfing candle is a day whose body covers the whole body of the day before, in the other color. The two days together are an engulfing pattern.
A bullish engulfing is a red day, then a green day whose body covers all of the red body, found after a fall. A bearish engulfing is the mirror: a green day, then a red day that covers it, found after a rise.
The free lesson on this page has three charts. You pick the one real engulfing out of three boxed pairs and call what follows it at a support zone, box a bearish engulfing after a rise, then meet a bullish engulfing that failed.
The charts are generated, with no ticker and no dates.
What is an engulfing candle?
The lesson's rule for a bullish engulfing: a red day, then a green day that opens at or below the red close and closes at or above the red open. The green body is the bigger one. The wicks don't count.
| Bullish engulfing | Bearish engulfing | |
|---|---|---|
| First day | Red | Green |
| Second day | Green, its body covers the red body | Red, its body covers the green body |
| Found after | A fall | A rise |
Steve Nison, whose 1991 book Japanese Candlestick Charting Techniques brought candlestick charts to Western traders, set three tests. The market must be in a clear trend, even a short one. The second body must cover the first body. It need not cover the wicks. The two bodies must be opposite colors, unless the first day is a doji.
The pattern is not finished until the second day closes. Nison made the same point: you only know it is an engulfing at that close.
Reading a body and its wicks is the first lesson, how to read candlesticks. The other named shapes are on the candlestick patterns page.
Do the wicks count?
No. Only the bodies count. The lesson's first question puts three boxed pairs side by side and asks which one is a bullish engulfing.
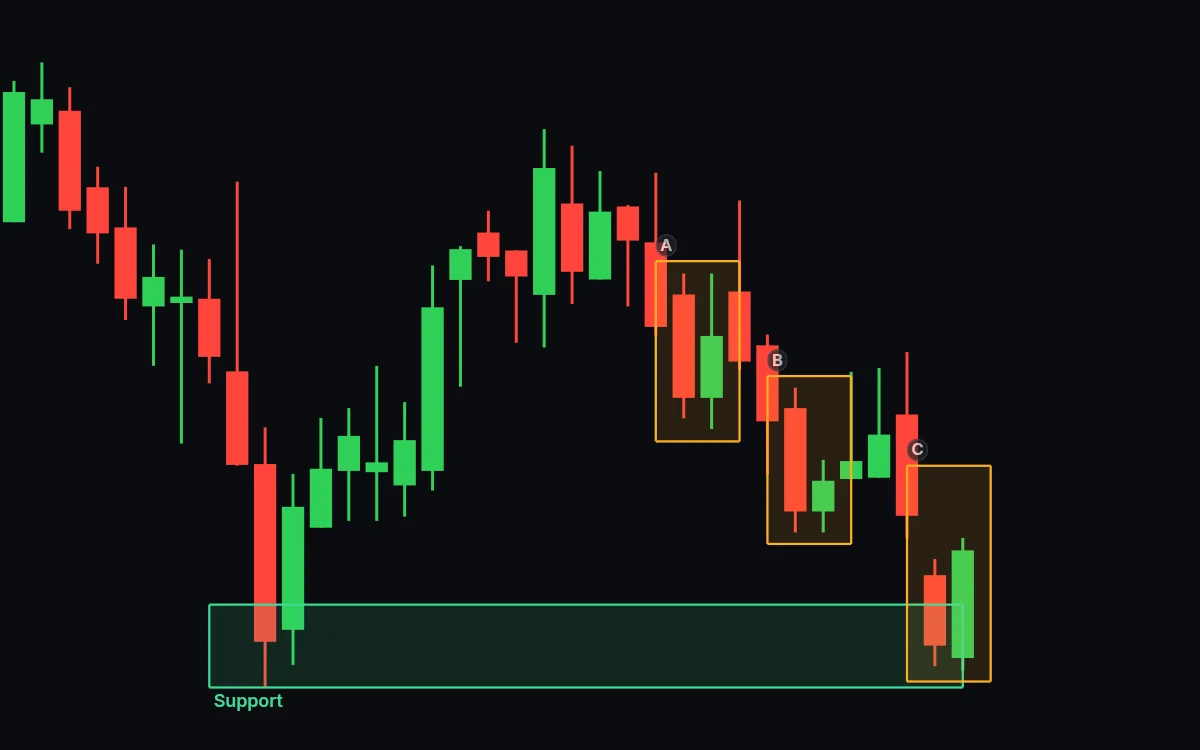
In pair A the green day's wicks reach above and below the red body. Its body does not: it closed at 148.54, under the red open of 149.51.
In pair B the green body sits inside the red one. Japanese candle traders call that a harami, the reverse of an engulfing.
Pair C is the engulfing. The red day opened at 142.94 and closed at 141.29. The green day opened lower, at 141.00, and closed at 143.52, above the red open. The green body is 1.5 times the red body.
What does a bullish engulfing mean?
Sellers won the first day. The second day opened even lower, so sellers looked in control again. By the close buyers had taken back the whole red day and more.
Nison read it as buying pressure overwhelming selling pressure. The pattern records two days that are over. It says nothing certain about the third.
The lesson then splits both days into 15-minute candles. The red day held near its open for half the session, then slid to the close. The green day spent its first half near 141. Buyers climbed through the second half and passed the red open with about two hours left.
Why does it matter where an engulfing forms?
A pattern at a price traders are already watching gets more attention. The lesson's pair formed inside a support zone, 140.31 to 142.25, set by a low 24 days earlier.
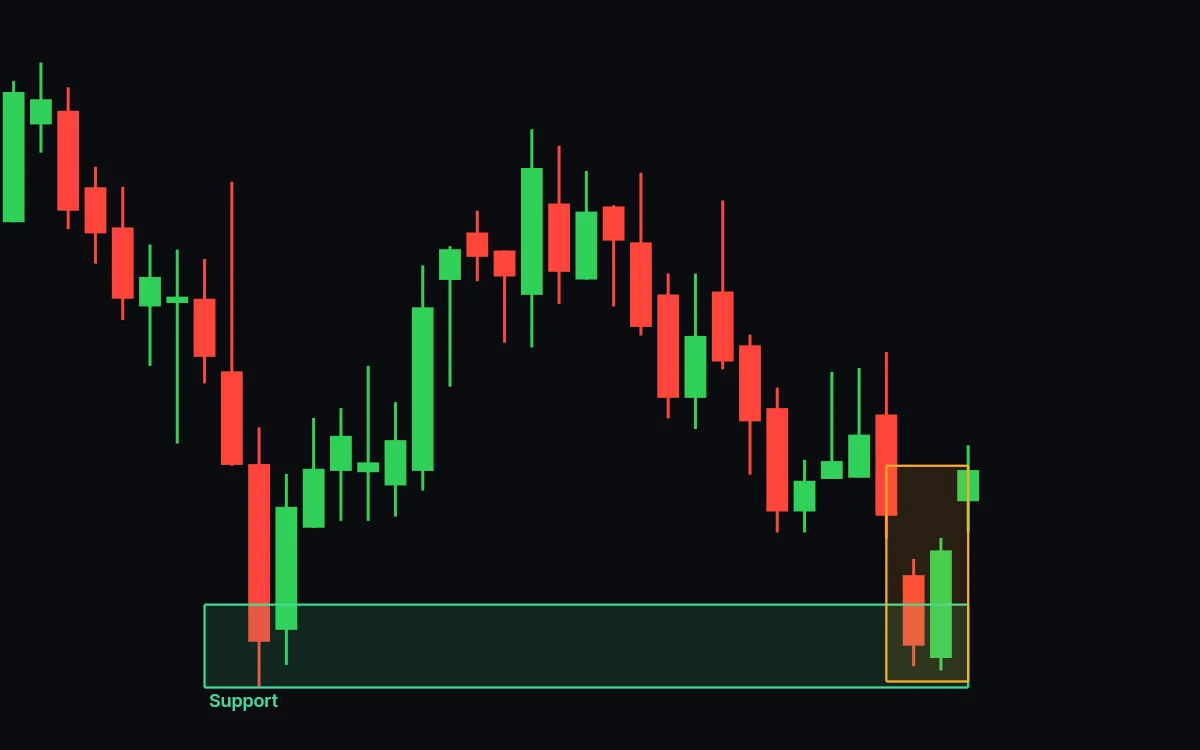
The green day's low, 140.71, sits inside that zone. The lesson asks: up or down from here?
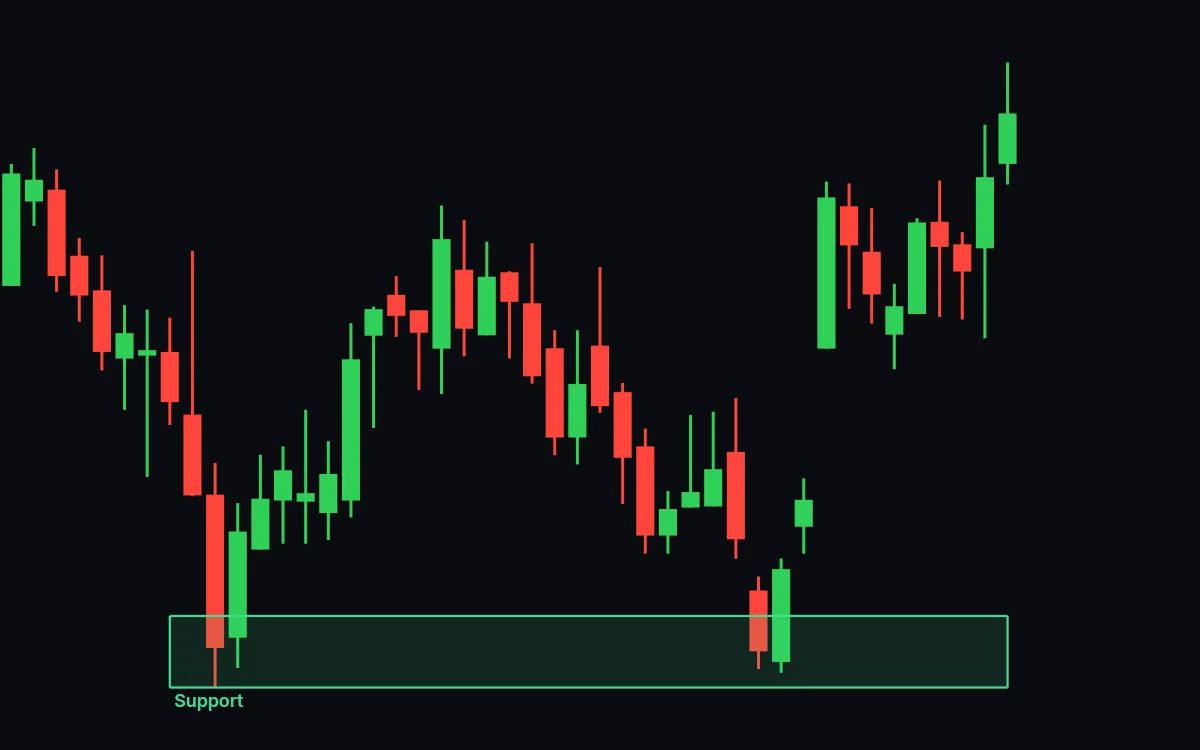
Up. The next day opened at 144.67, above the green close. Ten days after the pair the price closed at 155.88.
Nison treated the lowest low of a bullish engulfing pair as support, broken only by a close under it, as he did a hammer's low. On this chart that is 140.71. No close in the lesson came near it.
The lesson on how to find and draw support and resistance zones shows how to mark a zone like that.
What does a bearish engulfing mean?
A bearish engulfing is a green day wiped out by a red one, after a rise. Buyers won the first day. Sellers took all of it back on the second.
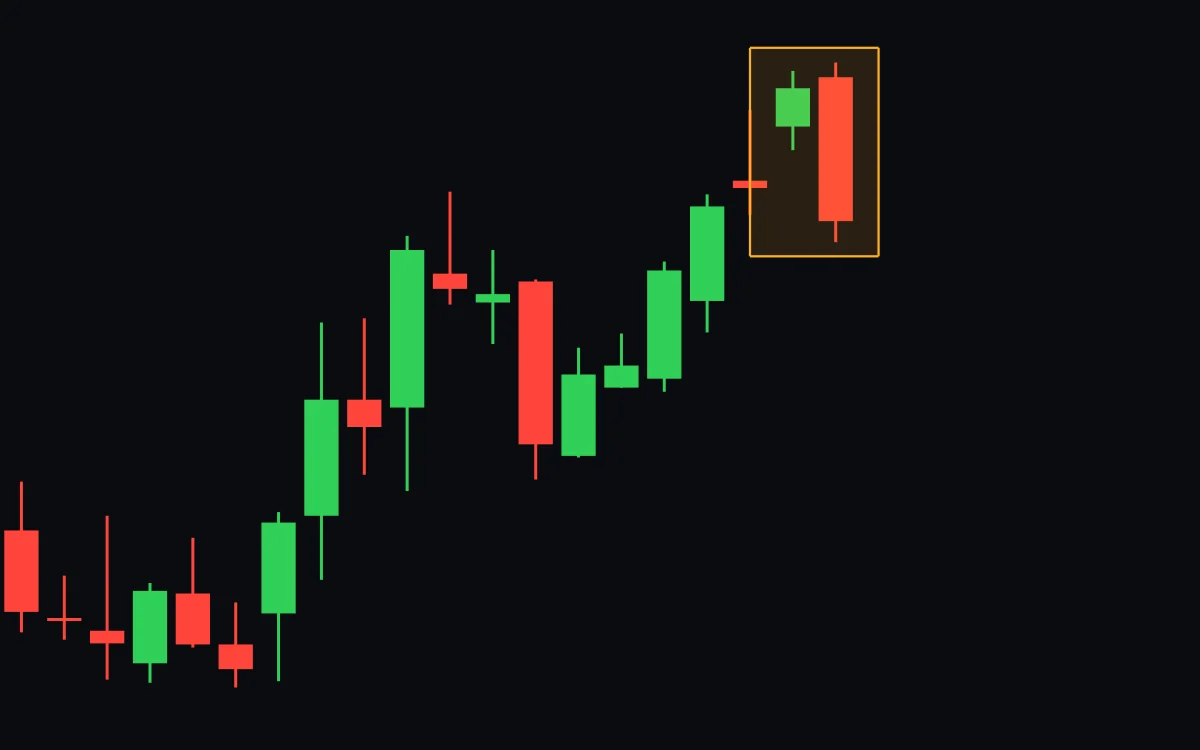
On the lesson's second chart the price rose from about 148 to 159 over two weeks. A small green day opened at 158.34 and closed at 159.07.
A red day followed. It opened 21 cents higher, at 159.28, reached 159.56 and closed at 156.54. The red body is almost four times the green one. The lesson asks you to draw a box over the two days.
Nison listed a small first body and a long second body among the signs that an engulfing could mark an important turn. This pair has both.
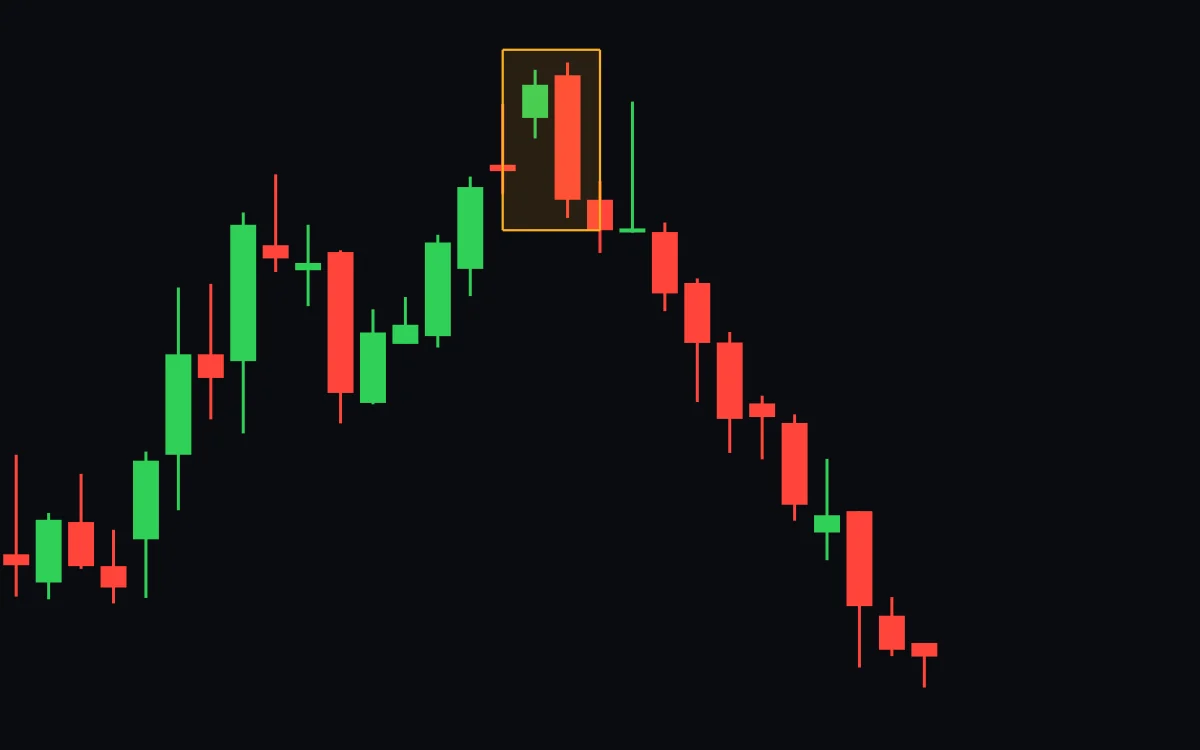
The lesson asks up or down. Down: eight of the next ten days were red, down to 146.49.
Nison used the highest high of a bearish engulfing pair as resistance, broken only by a close above it. Here that is 159.56. The best try came two days later, a wick to 158.70 that closed at 155.91.
How is an engulfing different from a harami or an outside day?
Each of these compares two days. Each looks at something different.
| Name | What it compares |
|---|---|
| Engulfing | The second body covers the first body |
| Harami | The second body fits inside the first body |
| Outside day | The second day's range covers the first day's range |
| Dark cloud cover | A red day that opens above a green day and closes deep in its body, short of covering all of it |
The outside day is the Western cousin. It compares whole ranges, wicks included, where the engulfing compares only bodies. An engulfing whose second day stays inside the first day's wicks is not an outside day.
Nison also set the engulfing beside the outside reversal day, which needs a new high for the move and a close under the day before. An engulfing needs no new high.
He compared the dark cloud cover to a partial eclipse of the sun and the bearish engulfing to a total one, which covers the whole green body.
Can an engulfing pattern fail?
Yes. The lesson's third chart shows one.
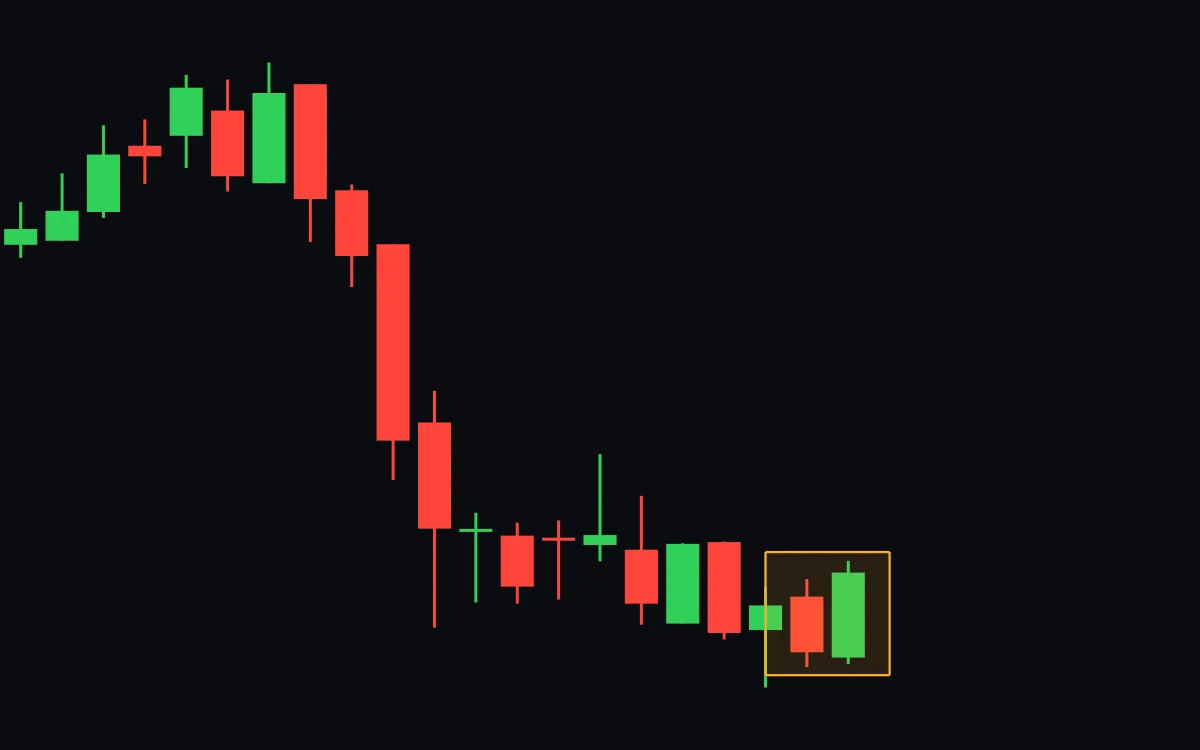
The price fell fast from about 153 to 146, then drifted lower for nine days. A red day opened at 144.74 and closed at 143.79. The next day opened at 143.70 and closed at 145.15, a green body that covers the red one. By the rule it is a bullish engulfing.
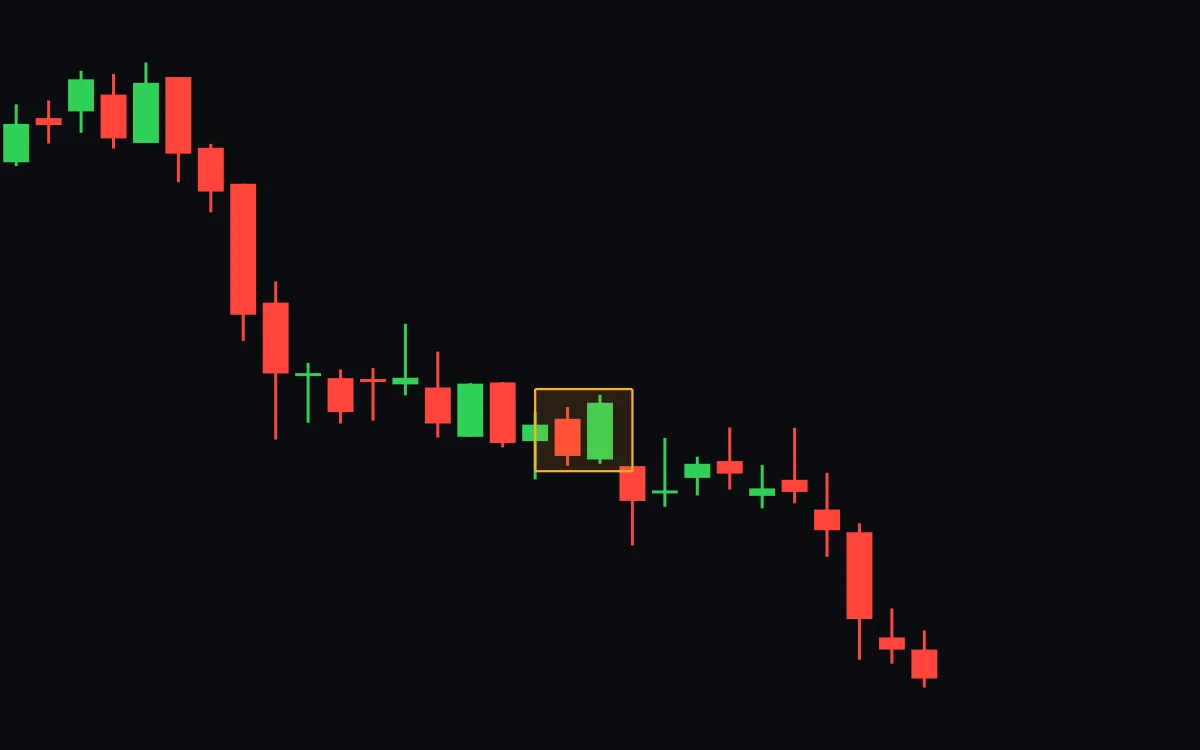
The lesson asks up or down. Down. The third day opened at 143.53, a cent under the pair's lowest low, and closed at 142.64. Ten days after the pair the price was at 138.10.
All the pair showed was one good day for buyers. By Nison's rule, the next day's close under the pair's low ended it.
Key points
- An engulfing pattern is two days: the second body covers the whole first body, in the other color.
- Bullish engulfing: red, then green, after a fall. Bearish engulfing: green, then red, after a rise.
- Only the bodies count. A body inside the one before is a harami.
- The pattern is finished only at the second day's close.
- Traders give the most weight to an engulfing at a zone they were already watching.
- Traders watch the pair's low (bullish) or high (bearish) as a level. A close beyond it undoes the pattern.
- Any engulfing can fail.
Press Start above and pick the real engulfing out of the three boxed pairs. An engulfing at a level counts for more. The lesson on how to find and draw support and resistance zones shows how to mark one.