A doji candle is a day that opened and closed at almost the same price. Its body is a thin line, a tenth of the day's range or less. Neither buyers nor sellers won that day.
A doji's meaning depends on where it forms. After a long rise or fall, traders read it as a pause in the move. In a sideways market it is an ordinary day.
The free lesson on this page has three charts. You pick the doji out of three boxed candles, call the day after one, judge a doji in a sideways market and meet the dragonfly and gravestone doji.
The charts are generated, with no ticker and no dates.
What does a doji candle look like?
A doji looks like a cross or a plus sign. The body is a flat line where the day opened and closed. The wicks reach up to the day's high and down to its low. Reading a body and its wicks is the first lesson, how to read candlesticks.
The test is the body against the range, the distance from the high to the low. A doji's body is a tenth of the range or less.
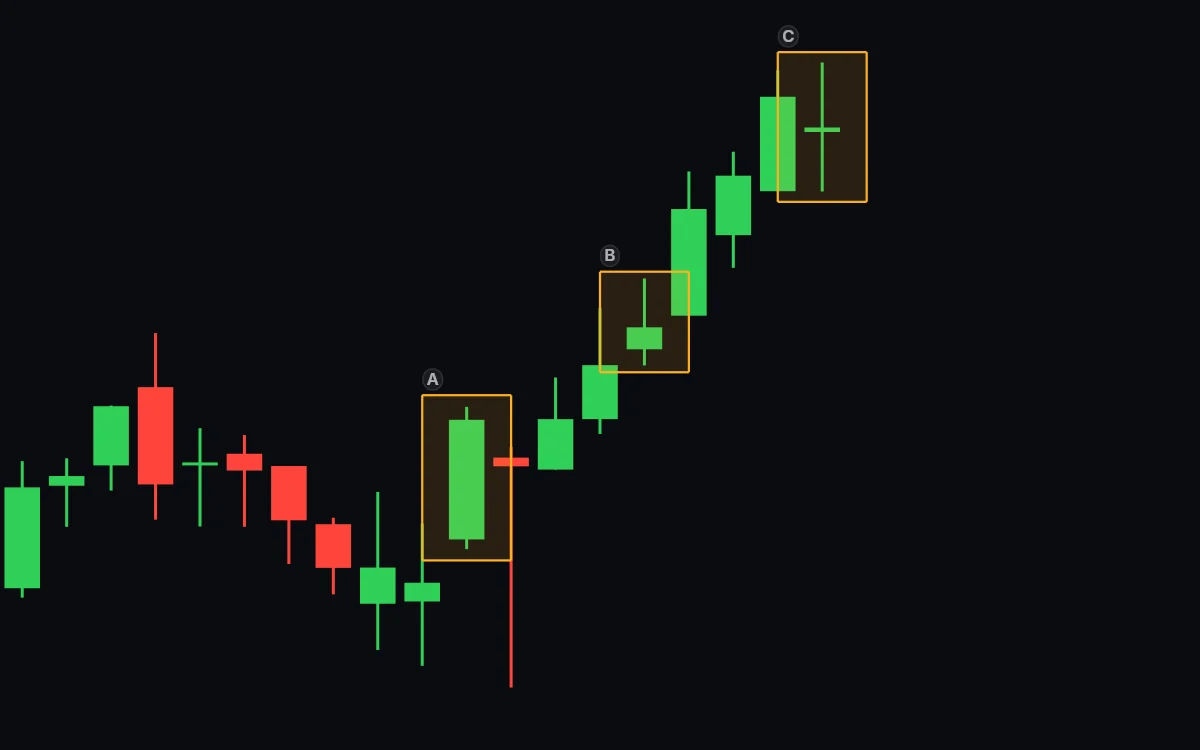
The lesson's first question boxes three candles on a rising chart:
| Candle | Body as a share of the range | Doji? |
|---|---|---|
| A | 84% | No, a big body |
| B | 25% | No, small but too thick |
| C | 3% | Yes |
Candle B is the one beginners pick. It looks small next to A. A quarter of the range is still a real body: the day closed well away from its open.
The lesson then takes the doji apart into 32 candles of 15 minutes each. Buyers had the price up early. Later sellers took it below the open. By the close it was back at the opening price.
A doji's color hardly matters. With the open and close this near each other, green or red comes down to a sliver of price.
What are the types of doji?
Four shapes carry their own names. Where the flat body sits in the day's range tells them apart.
| Type | Shape | What the day did |
|---|---|---|
| Doji | A flat body near the middle, wicks on both sides | Moved both ways and ended where it began |
| Long-legged doji | A flat body with very long wicks on both sides | Moved a long way both ways and ended where it began |
| Dragonfly doji | A flat body at the top, a long lower wick, almost no upper wick | Fell during the day, then closed back at the open and the high |
| Gravestone doji | A flat body at the bottom, a long upper wick, almost no lower wick | Rose during the day, then closed back at the open and the low |
The lesson covers the doji, the dragonfly and the gravestone. For the last two, the short wick is a tenth of the range or less. The other named candles are on the candlestick patterns page.
Is a doji bullish or bearish?
Neither, on its own. A doji records a day that ended where it started. The next day can go up or down.
The day's place on the chart decides how traders read it. After weeks of buying, a doji is a day the buyers did not win.
A doji can also open a two-day pattern. When the next day's body covers the doji's, Nison still counted the pair as an engulfing pattern.
What does a doji mean after a rise?
Traders read it as a pause. The side that had been winning day after day stopped winning for one day.
Steve Nison, whose 1991 book Japanese Candlestick Charting Techniques brought candlestick charts to Western traders, called a doji after a tall green candle a sign the market is tired. In his reading the trend changes from up to sideways. He did not call it a turn down.
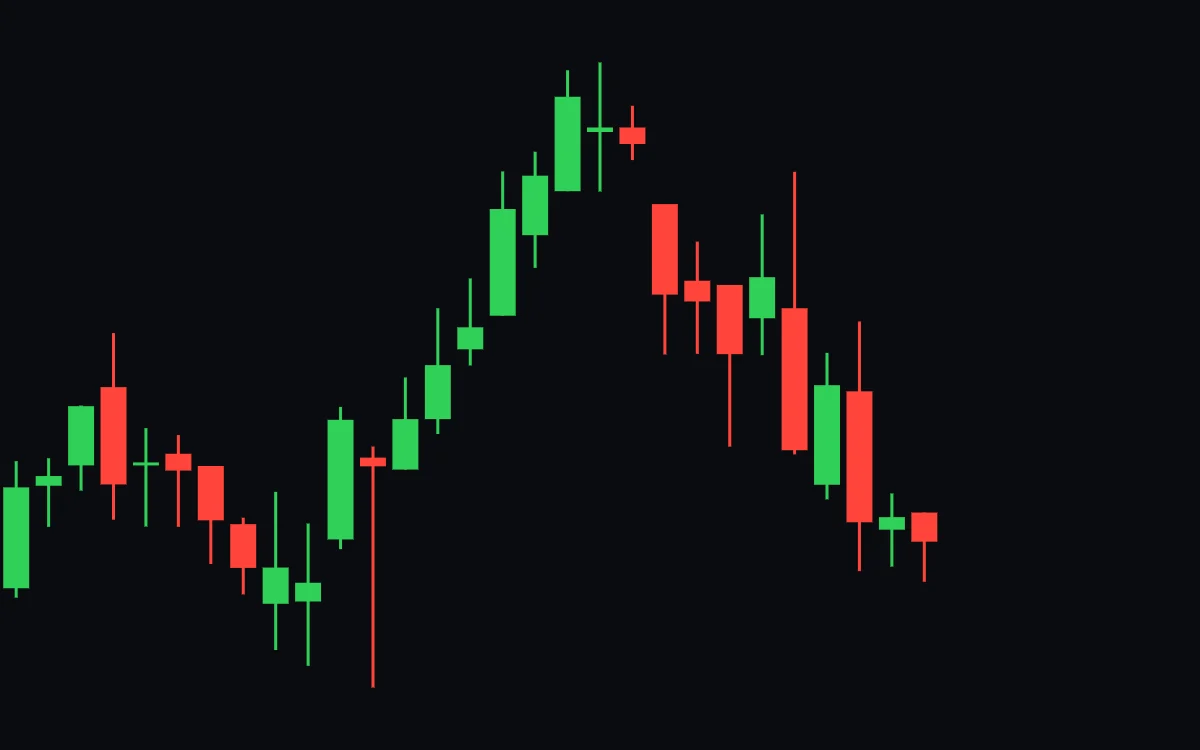
On the lesson chart the price went down after the doji. The next day closed a little lower, then the fall ran for more than a week. The lesson asks you to call it before you see it. A doji after a run can also be a short rest before the run goes on.
Does a doji mean anything in a sideways market?
Not much. When the price moves sideways between the same high and low, days that end where they began are normal.
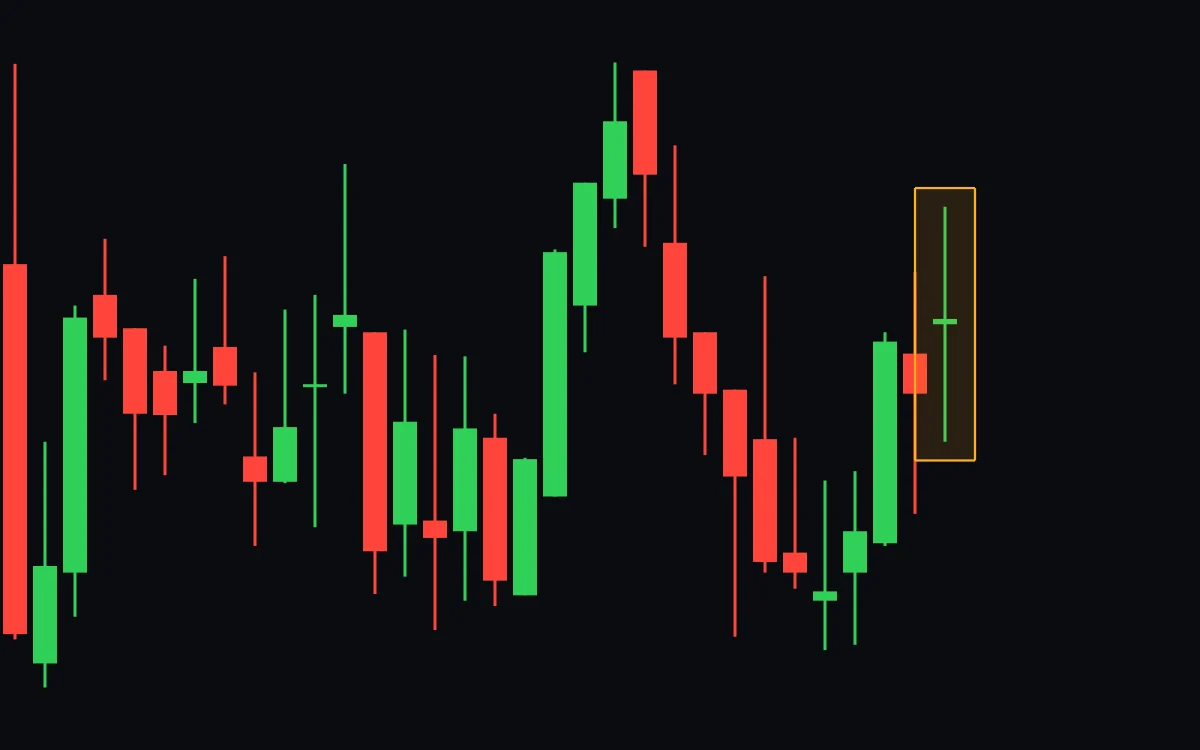
The lesson's second chart has four dojis inside one range. After each, the price kept moving sideways.
Nison drew the same line: a doji in the middle of a range says little, while a doji at the range's edge is worth watching. A doji also counts for more on a chart where dojis are rare. Four in a few weeks makes each one ordinary.
What is a dragonfly doji?
A dragonfly doji is a doji with a long lower wick and almost no upper wick. The day opened near its high. Sellers pushed the price far down, then buyers brought it all the way back by the close. The candle looks like a T.
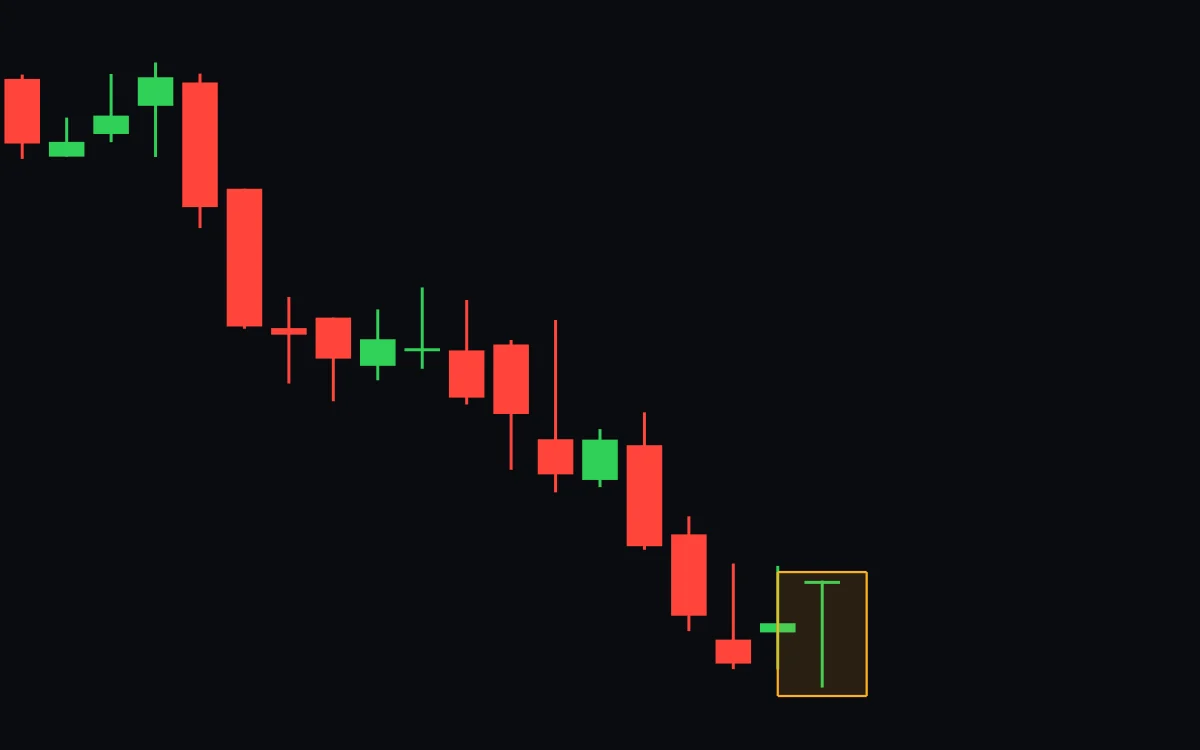
Traders look for a dragonfly after a fall, as a day sellers pushed the price down and could not keep it there. A hammer tells the same story with a small body on top in place of the line.
Any candle can fail, a dragonfly included. On the lesson chart the buyers who fought back that day did not show up again.
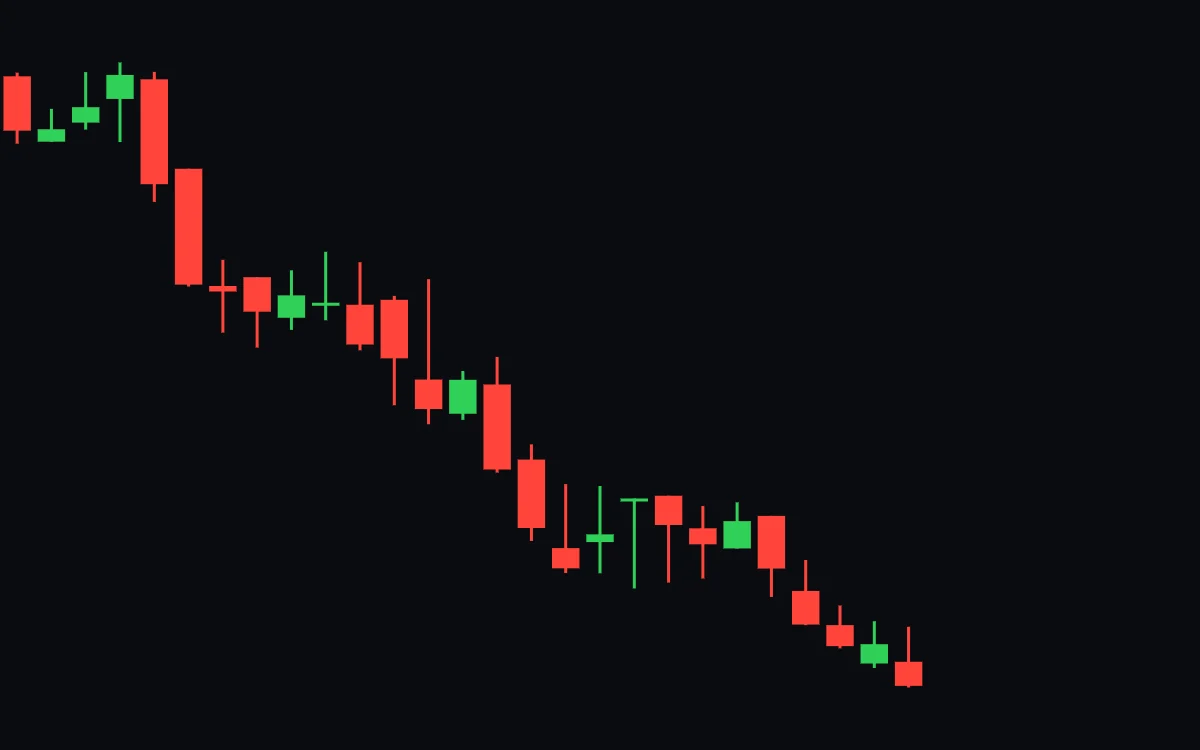
Two days later the price closed below the dragonfly's low. The fall went on for another week.
What is a gravestone doji?
A gravestone doji is a doji with a long upper wick and almost no lower wick. The day opened near its low. Buyers pushed the price far up, then sellers brought it all the way back by the close. The candle looks like an upside-down T.
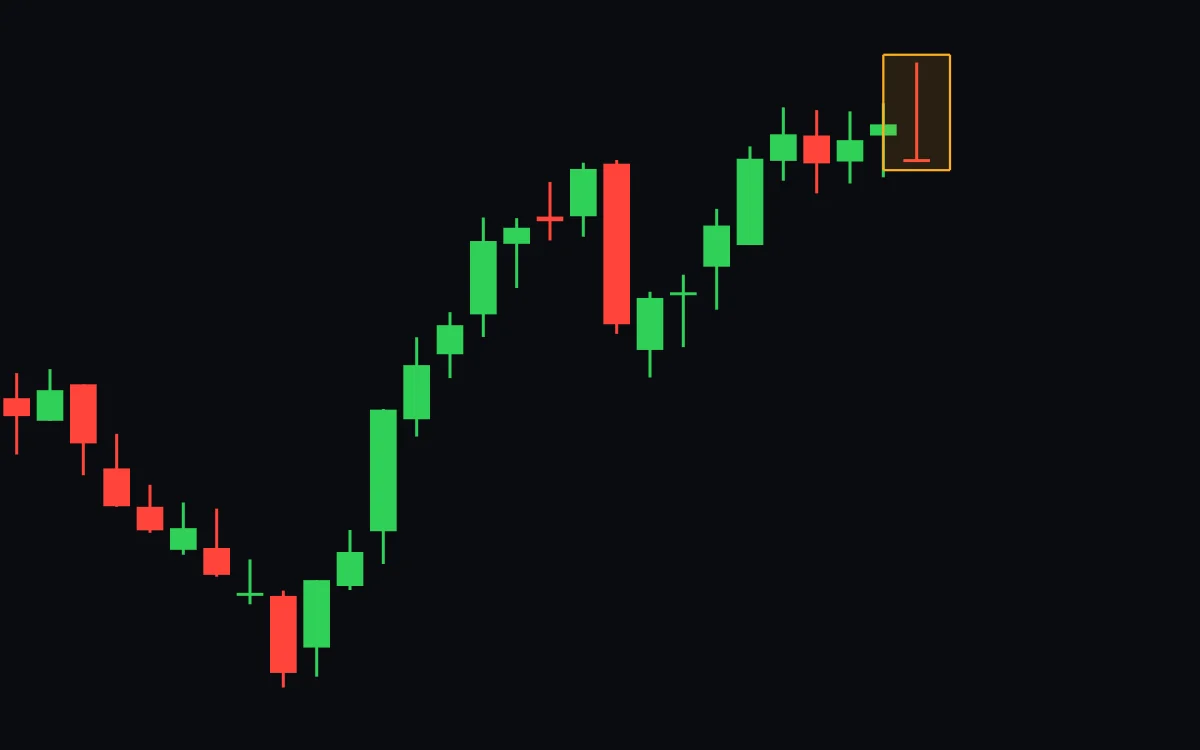
Traders look for a gravestone after a rise, as a day buyers pushed the price up and could not keep it there. A shooting star tells the same story with a small body in place of the line.
Key points
- A doji opens and closes at almost the same price: its body is a tenth of the day's range or less.
- Neither side won the day. A doji is neither bullish nor bearish on its own.
- After a long rise or fall traders read it as a pause. The days after it can go either way.
- In a sideways market dojis are ordinary days.
- A dragonfly closes at the top of a long lower wick, a gravestone at the bottom of a long upper wick.
Press Start above and find the doji among three boxed candles. A doji at a price where the chart turned before counts for more. The lesson on how to find and draw support and resistance zones shows how to mark those prices.