A bull flag pattern is a fast rise followed by a short pause. The rise is the pole. The pause is the flag: a narrow drift down, against the rise, that gives back less than half of it.
A bear flag is the same shape upside down: a fast fall, then a short drift up.
Traders watch the flag's edge on the side the pole points to: the upper edge for a bull flag. Until a candle closes through it, the shape is only a potential flag.
The free lesson on this page has three charts. You draw a bull flag's upper edge and call the candle that touches it, name a bear flag, then judge a pullback that went too deep to count.
The charts are generated, with no ticker and no dates.
What does a bull flag look like?
| Part | What it is |
|---|---|
| Pole | A fast, steep rise over a few days |
| Flag | A short drift down in a narrow channel after the pole |
| Upper edge | A line from the top of the pole along the flag's highs |
| Lower edge | A parallel line along the flag's lows |
| Break | A candle closing above the upper edge |
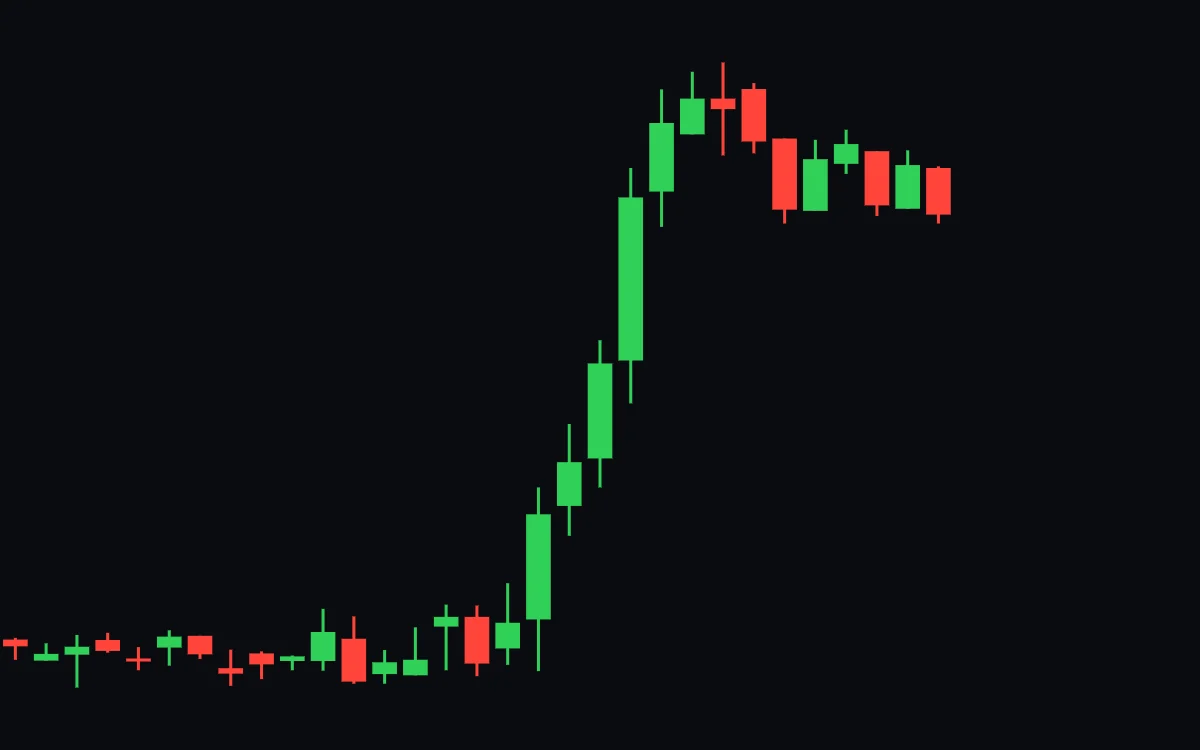
On the lesson's first chart the price moves sideways near 141 for more than two weeks. Then it climbs from a low of 141.04 to a high of 155.64 in eight days, six of them green in a row. The rise is about fifteen times the average daily range of the two weeks before. Thomas Bulkowski's Encyclopedia of Chart Patterns calls the "rapid, steep price trend" the most important guideline for a flag.
After the top the price drifts lower for eight days in a narrow band. StockCharts' ChartSchool describes a flag as "a small rectangle pattern that slopes against the previous trend."
How deep can a flag go?
The lesson's rule has two parts. A flag gives back less than half of the pole. It also lasts no longer than the pole did.
On the first chart the flag's lowest low is 149.73. That gives back 5.91 of the pole's 14.60 points, about 40%. The flag lasts eight days, as long as the pole and no longer.
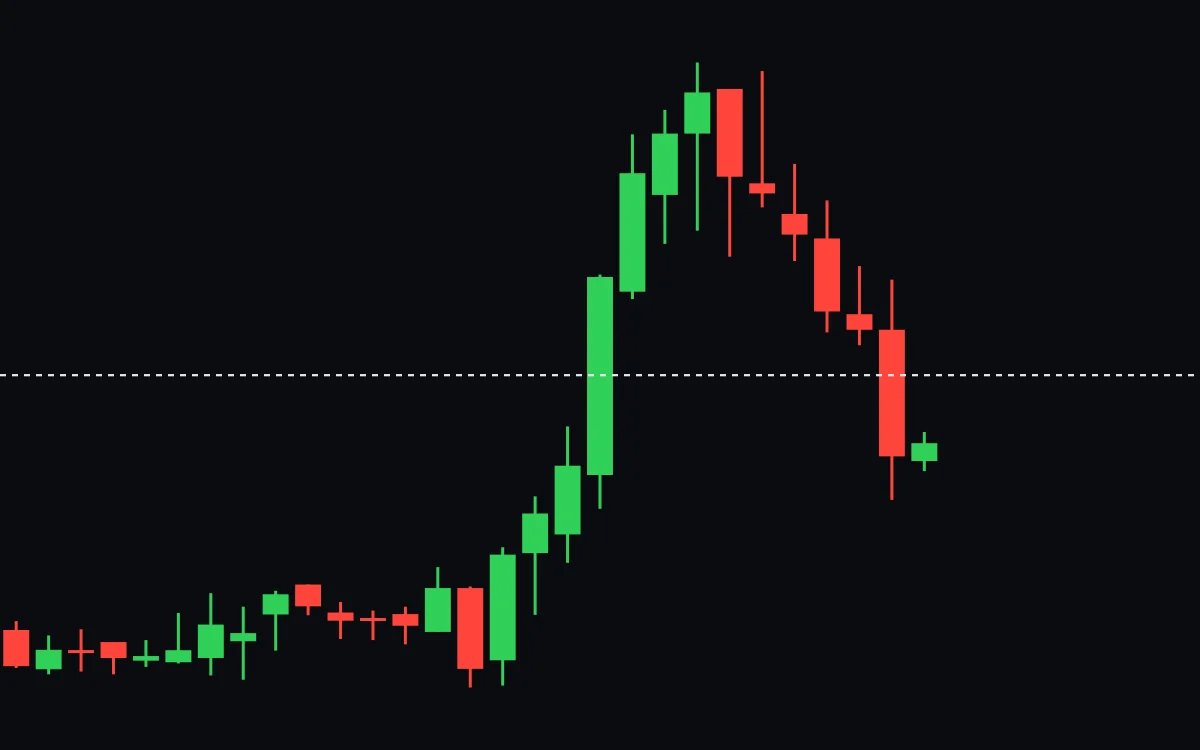
The lesson's third chart climbs from 143.95 to 160.04 in seven days. The dashed line marks half the pole, at 151.99. Six days after the top the pullback has reached 148.78, below the line. It gave back 70% of the pole.
The lesson asks whether this is a flag. By its rule it is not.
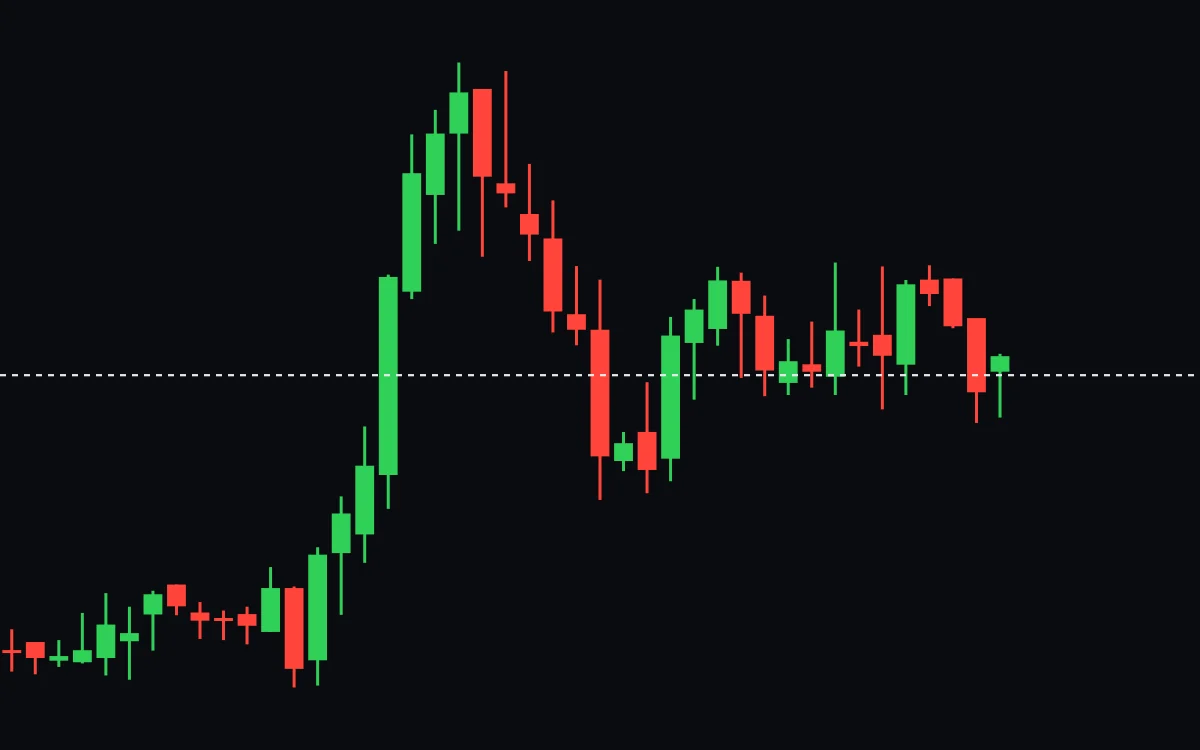
From there the price moved sideways between about 149 and 155 for more than two weeks. The lesson makes no claim about where it went next.
Half the pole is a common limit in trading guides. Other guides count bars or weeks instead.
How long does a flag last?
The lesson ties the flag's length to the pole: no longer than the pole took.
Guides that use the calendar disagree. ChartSchool gives flags one to 12 weeks and adds "Ideally, these patterns will form between one and four weeks." Past 12 weeks it calls the shape a rectangle. Bulkowski sets a few days to three weeks and calls that "an arbitrary limit." John Murphy's Technical Analysis of the Financial Markets gives one to three weeks after a near-vertical pole.
All of them agree on the order: the pole is fast, the flag is short and slow.
Where do you draw a bull flag's lines?
Draw the upper edge from the top of the pole along the flag's highs. Draw the lower edge parallel to it along the lows.
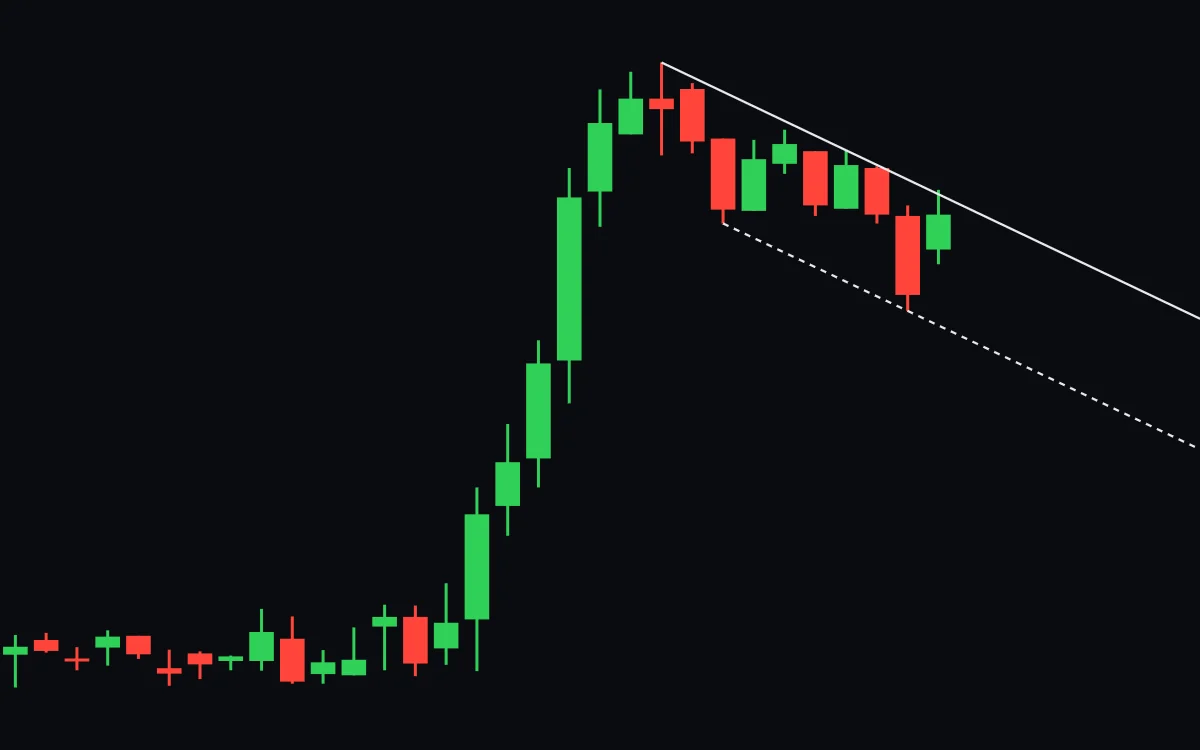
On the lesson chart the upper edge starts at the pole's top, 155.64, and runs through a flag high of 153.55. It falls about 0.35 a day. The lower edge runs through the flag's lows at 151.81 and 149.73.
In the lesson you draw the upper edge yourself. The lower edge is already on the chart.
When does a bull flag break out?
When a candle closes above the upper edge. A wick above it does not count. A long wick is a price the day reached and gave back by the close.
The lesson stops on a candle that touched the upper edge from below. Its high was 152.61, a dime above the line. It closed at 152.02, under the line. The lesson asks whether the line holds or breaks.
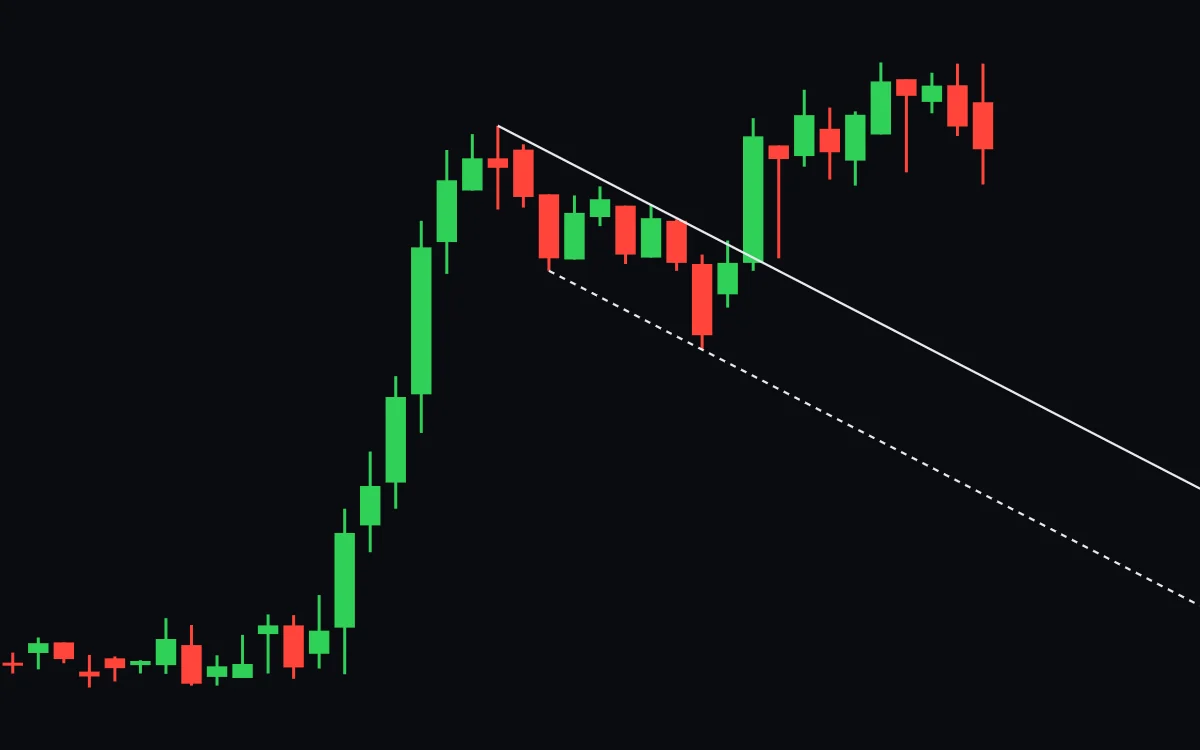
The next day closed at 155.36, more than three points above the line. That close is the break. Now traders call it a bull flag.
The day after, the price dipped to 152.14 and closed at 154.76, still above the line. Five days after the break it reached 157.31, above the top of the pole. Four days later it closed at 155.02.
Many guides also want volume to be heavy on the pole and to rise on the break. The lesson leaves volume out and judges the break on the close.
Many guides add the pole's height to the break as a price target. The lesson sets no target.
What is a bear flag pattern?
A bear flag is a fast fall, then a short drift up in a narrow channel. It forms partway down a fall. It breaks on a close below the flag's lower edge.
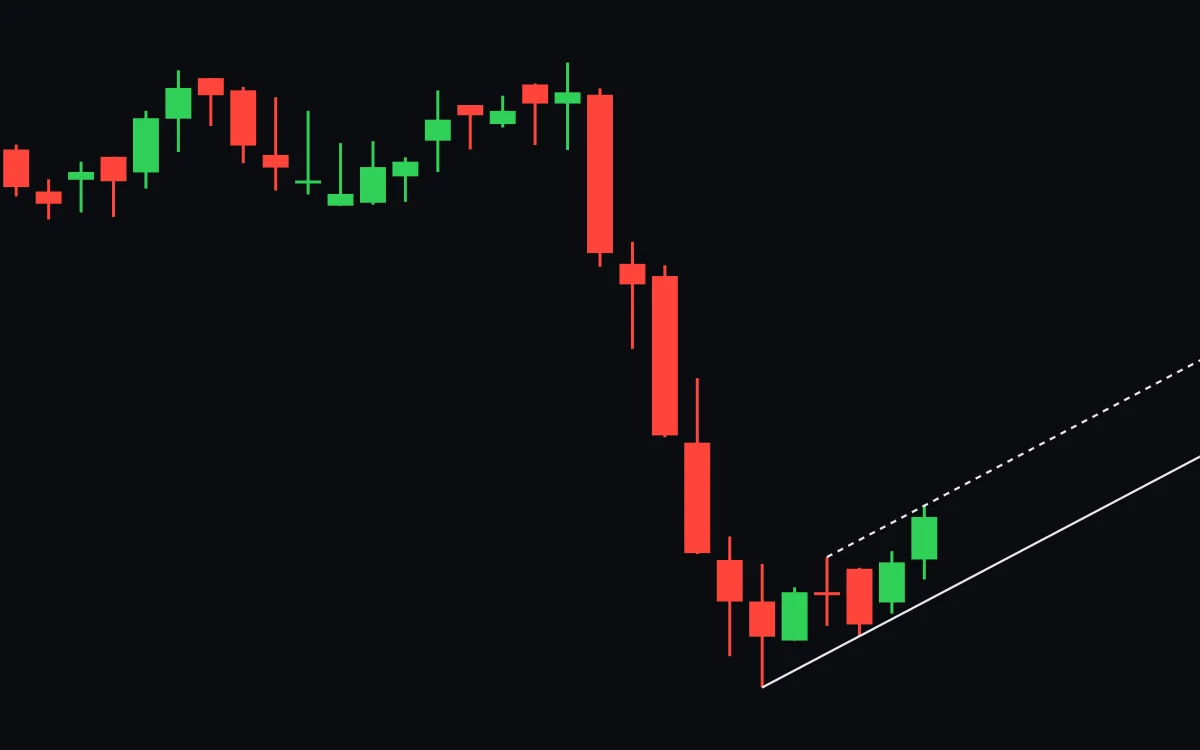
The lesson's second chart moves sideways between about 151 and 154 for more than two weeks. Then it falls from 154.07 to 141.28 in six red days in a row. The drift up after it lasts five days and reaches 145.00. That takes back 3.72 of the 12.79-point fall, about 29%.
The lesson asks whether this is a bull flag, a bear flag or no flag. The pole points down, so it is a potential bear flag: a pause in a fall.
The flag's lower edge runs from the pole's low at 141.28 through a flag low at 142.33. It rises about 0.35 a day.
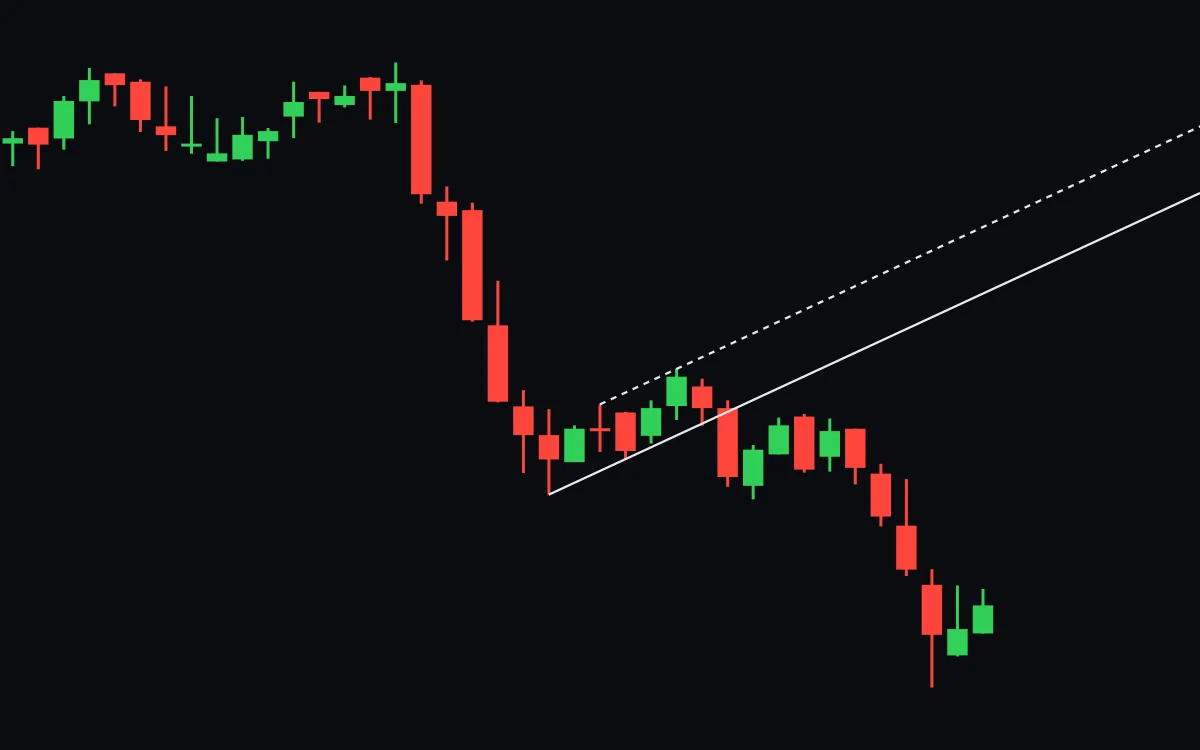
The next candle's low rested on the edge. It closed above it, at 143.84. The day after closed at 141.80, below the edge. That close is the break.
The price did not fall straight away. It stayed under the edge, between about 141 and 144, for five days. Then it fell to a low of 135.57.
Can a flag fail?
Yes. Any pattern can fail. A flag can break the other way, through the edge on the far side. A close through the expected edge can also fall back inside the flag.
A close through an edge that does not stay there is a false break. The lesson's two flags both break the way their pole points. The third chart shows another common miss: a pullback too deep to be a flag at all.
What is the difference between a flag and a pennant?
A pennant is a pole followed by a small triangle: the highs come down and the lows come up until they meet. A flag's edges run parallel. Bulkowski puts it plainly: "The only visual difference between a flag and a pennant is the shape."
The lesson covers flags only.
Where do flags come from?
Robert Edwards and John Magee described flags in Technical Analysis of Stock Trends, first published in 1948.
The ten patterns Andrew Lo, Harry Mamaysky and Jiang Wang tested in the Lo, Mamaysky and Wang study did not include flags.
The other patterns, each with the line traders watch, are on the chart patterns page.
Key points
- A bull flag is a fast rise (the pole), then a short, narrow drift down (the flag).
- By the lesson's rule the flag gives back less than half the pole and lasts no longer than it.
- The upper edge runs from the top of the pole along the flag's highs.
- It stays a potential bull flag until a candle closes above the upper edge. A wick does not count.
- A bear flag is the mirror image: a fast fall, a drift up, a close below the lower edge.
Press Start above and draw the flag's upper edge. The next lesson, the cup and handle pattern, waits on a close above an old high the same way.