Risk to reward is what a trade loses if it hits your stop loss, compared with what it makes if it hits your take profit. The risk to reward ratio (RR) writes the two side by side: risk $100 to make $300 and the trade is 1:3.
A higher RR lowers the number of wins you need to break even. At 1:3, one win in four breaks even. It does nothing to make you win that often.
The free lesson on this page lets you move a take profit and watch the break-even win rate change. Then it tests every target on a chart that moves at random.
How do you calculate the risk to reward ratio?
Compare the distance from your entry to your stop with the distance from your entry to your target.
Say you buy at $50, put the stop at $45 and the target at $65:
- Risk: $50 − $45 = $5 per share
- Reward: $65 − $50 = $15 per share
- Risk to reward: $5 to $15, or 1:3
The same entry with a target at $55 is 1:1. Only the target moved.
The cost of one loss is called 1R. A win at 1:3 is +3R and a loss is −1R, whatever the stock price or the position size.
Tracking trades in R lets you compare a $15 stock with a $150 one.
Some platforms write it the other way round, as reward to risk, so 3:1 is the same trade as 1:3. Check which order a number uses before you compare it.
What win rate do you need to break even?
At 1:R, one win in every R + 1 trades.
| Risk to reward | Break-even win rate |
|---|---|
| 1:1 | 1 in 2 (50%) |
| 1:2 | 1 in 3 (33%) |
| 1:3 | 1 in 4 (25%) |
| 1:4 | 1 in 5 (20%) |
| 1:5 | 1 in 6 (17%) |
| 1:7 | 1 in 8 (12.5%) |
At 1:4, one win makes 4R and four losses cost 4R. So 1 win in every 5 trades breaks even, and more than that makes money.
Does a higher risk to reward ratio make more money?
Not on its own. A target twice as far away pays twice as much and gets hit about half as often.
The lesson tests this on a chart that moves up and down completely at random. Every trade has its stop 1R below the entry and a take profit somewhere from 1R to 7R above it.
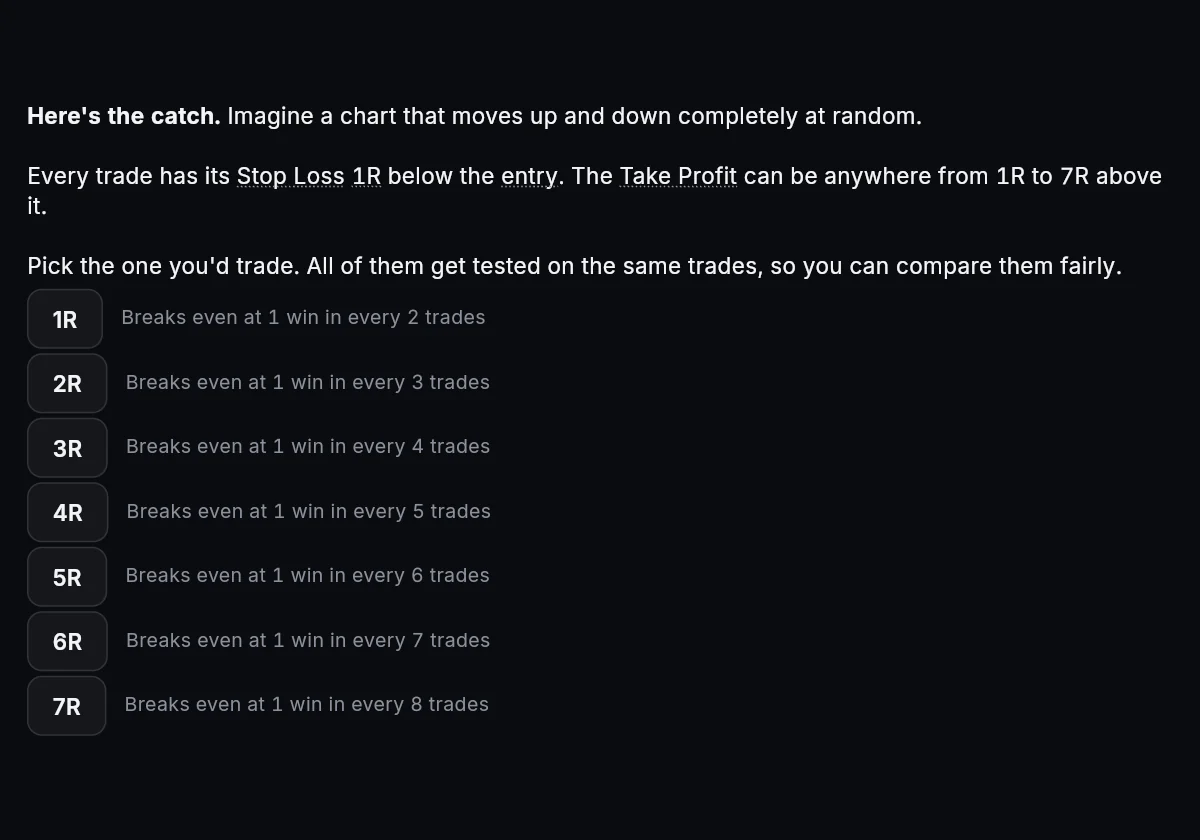
Each target gets hit about as often as its break-even rate: 1 in 2 at 1R, 1 in 4 at 3R, 1 in 8 at 7R. So every target breaks even.
That follows from the math of a random walk, where the chance of reaching +kR before −1R is 1 in k + 1.
Real markets are not a pure random walk, and nobody can promise that a 7R target gets hit 1 time in 8.
On any chart the RR sets only the bar. A 7R target hit 1 time in 9 loses 1R every 9 trades. Hit 1 time in 7, it makes 1R every 7 trades. The RR is the same in both.
Where does the money come from?
From winning more often than your RR needs. At 1:2 you need 1 win in 3. A strategy that wins 4 in 10 at 1:2, risking $100 a trade:
- 4 wins × $200 = $800
- 6 losses × $100 = $600
- Result: +$200 every 10 trades
The gap between 4 in 10 and 1 in 3 is the edge, and it comes from picking better trades.
A higher RR has a cost too. You win less often, so your losing streaks get longer.
A 1:4 strategy that wins 1 trade in 5 has a typical worst streak of 15 losses in 100 trades, which is why a higher RR needs a smaller risk per trade.
What breaks your risk to reward after you enter?
Moving the stop. Say your 1:2 trade goes against you and you move the stop twice as far away to give it room.
A loss now costs 2R and a win still pays 2R. The trade is 1:1, and you need 1 win in 2 instead of 1 in 3.
Chasing does the same from the other side. Buy late and the entry moves toward the target, as the FOMO lesson shows with a 1:3 plan that turned into 1:0.2.
Key points
- Risk to reward compares the distance to your stop with the distance to your target. $5 of risk for $15 of reward is 1:3.
- At 1:R you break even by winning 1 trade in R + 1.
- On a random chart every target breaks even. RR sets the win rate you need to break even.
- An edge is winning more often than your RR needs.
Press Start above and move your first take profit. That is the last risk lesson. The trading psychology lessons cover what holding, revenge and FOMO do to these numbers.