To find support and resistance, look for prices where the chart turned at least twice, and draw each one as a zone. Resistance runs from the highest close up to the highest wick. Support runs from the lowest close down to the lowest wick.
The zone matters because price rarely turns at the same number twice. Two tops at $48.20 and $47.80 sit inside one zone. A line at $48.00 misses both.
The free lesson on this page has you draw the zones yourself on four charts, then call whether price holds when it comes back. Its charts are generated from real Bitcoin daily price swings, with no ticker or dates, so the chart is the only thing you can read.
What are support and resistance levels?
Resistance is a price where a rising chart stopped and turned down more than once. Support is a price where a falling chart stopped and turned up more than once.
Each level is a record of where traders acted before. It is also a bet that some of them, and new traders watching the same chart, will act there again. The support and resistance trading page measures how often that bet pays.
Why does price keep turning at the same level?
Resistance forms because the traders who sold at the first top remember the price. When price comes back, some of them sell again, and traders who missed the first top sell with them.
Round numbers make it stronger. Carol Osler of the Federal Reserve Bank of New York studied the support and resistance levels that six trading firms sent their customers from January 1996 to March 1998.
"More than 70 percent of the support and resistance levels in the sample end in 0, and a full 96 percent end in either 0 or 5," she wrote in the Bank's Economic Policy Review (July 2000). Random levels would end in 0 or 5 only 20 percent of the time.
How do you draw a resistance zone?
Start with a line at the highest wick. It marks the top, but the candles around it closed lower, so the line misses the second top.
Add a second line at the highest close. The space between the two lines is the zone.
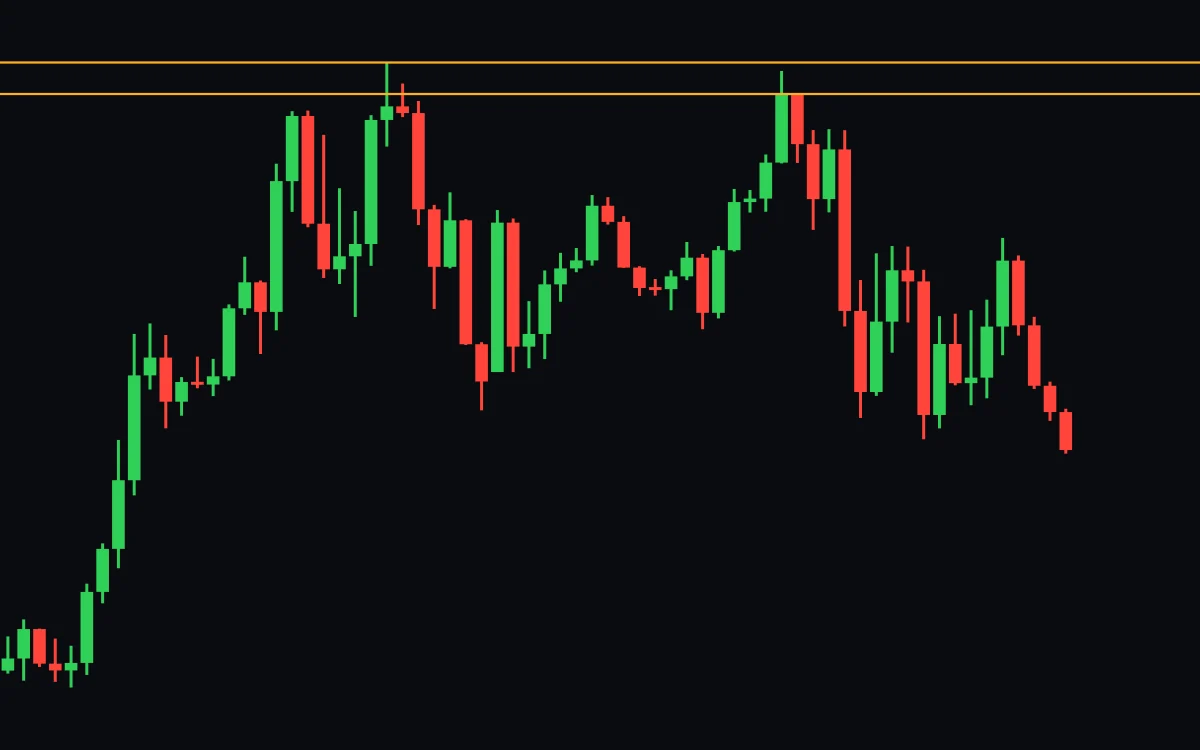
The zone covers both the wicks and the closes, the whole range price used. In the lesson you draw it as one box.
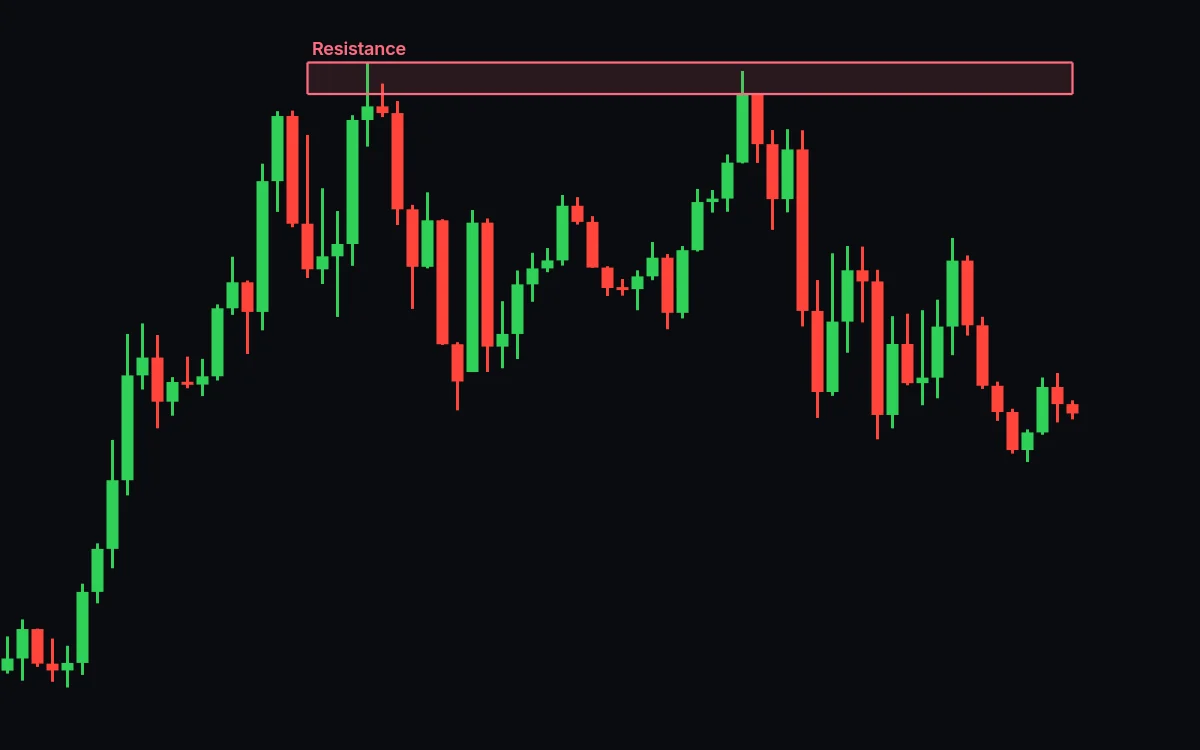
Many traders start the zone at the close because that is where buyers gave up for the day.
Some draw it from the candle bodies only and treat the wicks as noise. Either works if you use the same rule every time.
Support is drawn the same way from the lows: a box from the lowest close down to the lowest wick. The lesson's last two charts are support.
Why draw a zone instead of a line?
A line at one price gets you stopped out on a top a zone would have covered. Price tops at $48.20 one week and $47.80 the next. You draw resistance at $48.00 and sell short there, with a stop at $48.10.
The first top reaches $48.20 and stops you out. Then price turns down, the way you expected.
A zone from $47.80 to $48.20 covers both tops. A stop above the whole zone, at $48.40, survives both.
Does a third test make a level stronger or weaker?
It can do either, and traders read a third touch in two opposite ways.
| Reading | The argument |
|---|---|
| Every touch makes the level stronger | More traders notice it, so more orders gather there |
| Every touch makes the level weaker | Each test uses up some of the sellers waiting there, until none are left |
On the lesson's first chart the zone held on the third try. Price dropped away from it fast, the usual sign that a level held. A poke through the zone that closes back inside is a false breakout.
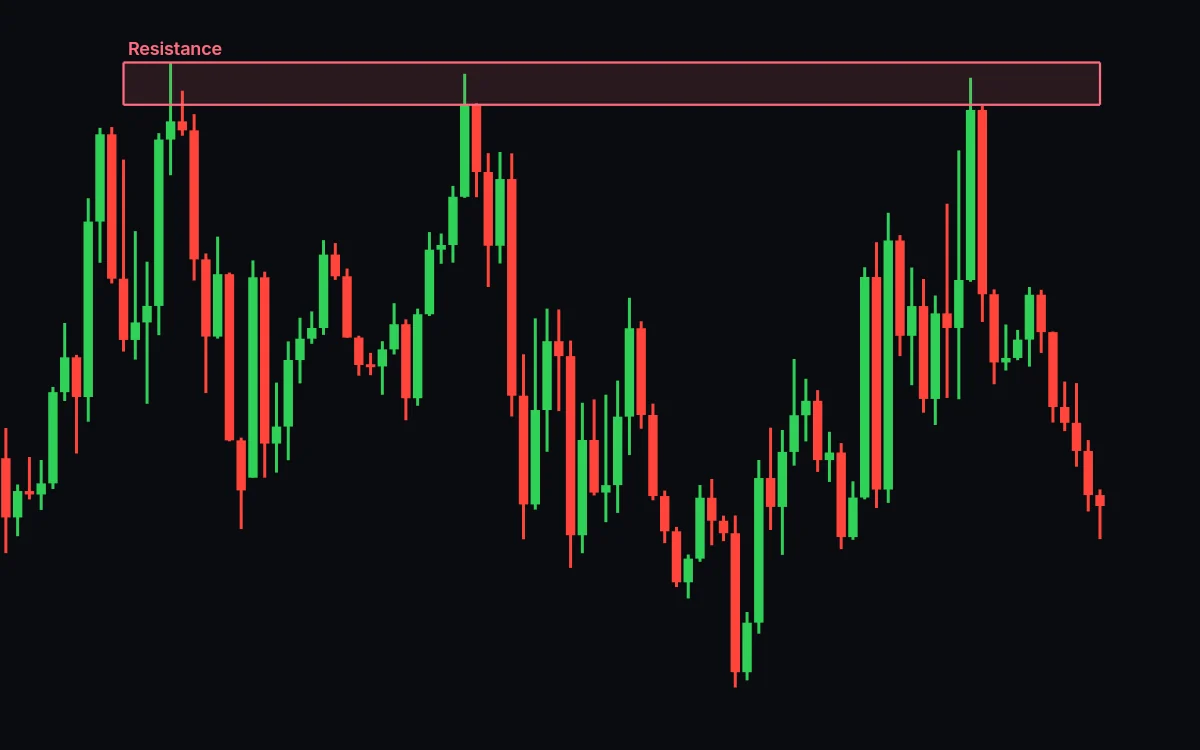
How many support and resistance levels should you draw?
Draw three to five zones per chart. Mark every turn and every price ends up near some line, which tells you nothing.
Start on a longer timeframe than the one you trade. If you trade an hourly chart, mark the daily levels first. More traders watch the longer timeframe, so its levels draw more orders.
Key points
- Resistance is a price where a rising chart turned down more than once. Support is where a falling chart turned up.
- Draw resistance from the highest close up to the highest wick, and support from the lowest close down to the lowest wick.
- Draw a zone, and put any stop beyond the whole of it.
- A hold looks like a fast move away from the zone.
Press Start above and draw the first zone yourself. Levels do not always hold, and lesson 2 covers what counts as a break.