A double top pattern is two highs at about the same price with a dip between them. The lowest point of that dip is the line traders watch. Until a candle closes below it, the shape is only a potential double top.
A double bottom is the mirror: two lows at about the same price, confirmed by a close above the highest point between them.
The free lesson on this page has you mark both on three charts. You draw the first top's zone, mark the two tops and draw the line, then call what the price does at it. On one of the three charts the pattern never confirms.
The charts are generated, with no ticker and no dates.
What does a double top look like?
A double top starts with a rise. The price makes a high and turns down: a swing high, with lower candles on both sides of it.
It falls for a while, climbs back to about the same price and turns down again.
| Part | What it is |
|---|---|
| First top | A swing high after a rise |
| Zone | From the top of the first top's body up to the tip of its wick |
| Second top | A later high that turns down inside that zone |
| Line | The lowest point between the two tops |
| Confirmation | A candle closing below the line |
The zone is the one the support and resistance lessons draw. The price rarely turns at exactly the same number twice, so the second top only has to reach the first top's zone.
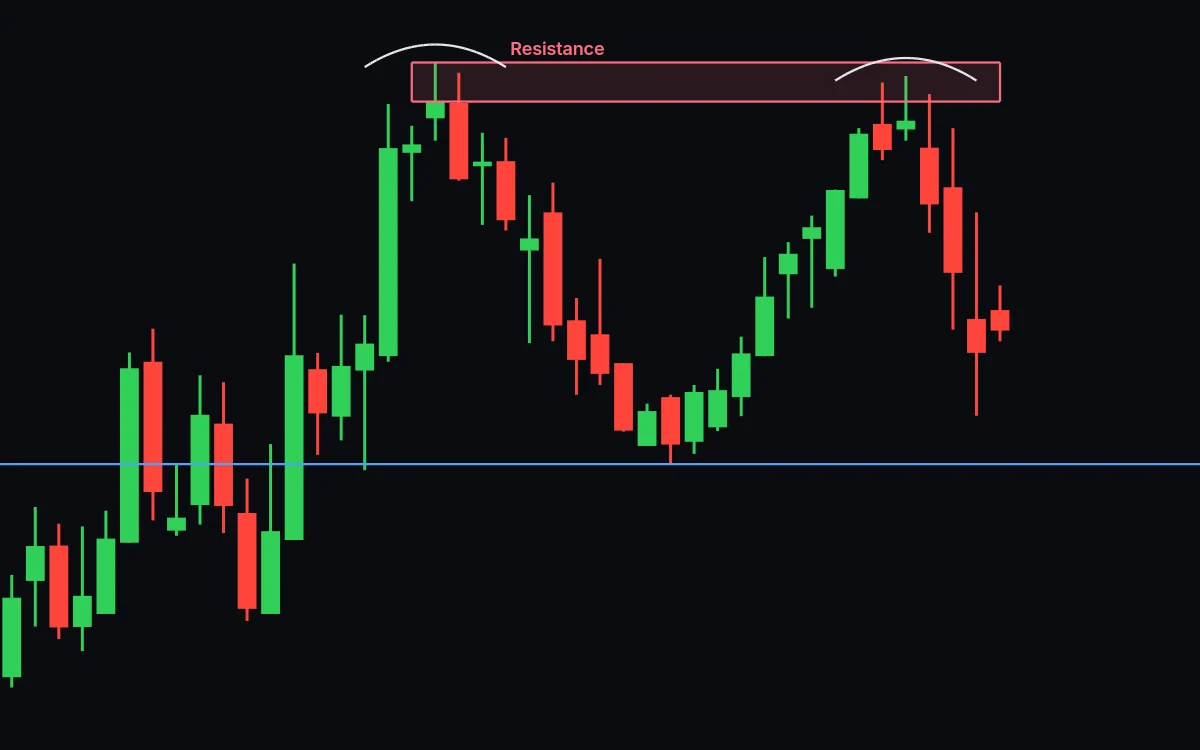
Say the first top's highest body ends at $51.90 and its wick reaches $52.40. The zone runs from $51.90 to $52.40.
The price drops to $48.70, climbs to $52.10 and turns down. $52.10 is inside the zone, so that is a second top.
The line is $48.70.
How close do the two tops have to be?
Guides disagree. StockCharts' ChartSchool says a second peak within 3% of the first is usually close enough. The lesson uses the zone instead: the second top has to turn down between the first top's body and the tip of its wick.
In the example the tops are $52.40 and $52.10, about 0.6% apart.
When is a double top confirmed?
A double top is confirmed when a candle closes below the line. Until that close the lesson calls it a potential double top, even with both tops in place.
A wick below the line does not count. A long wick is a price the day reached and gave back by the close. Buyers stepped in under the line and pushed the price back above it.
In the example, a day that dips to $48.50 and closes at $48.90 has confirmed nothing. A close at $48.40 does.
The close is also what separates this chart from one where the pattern fails. Both look the same until that candle prints.
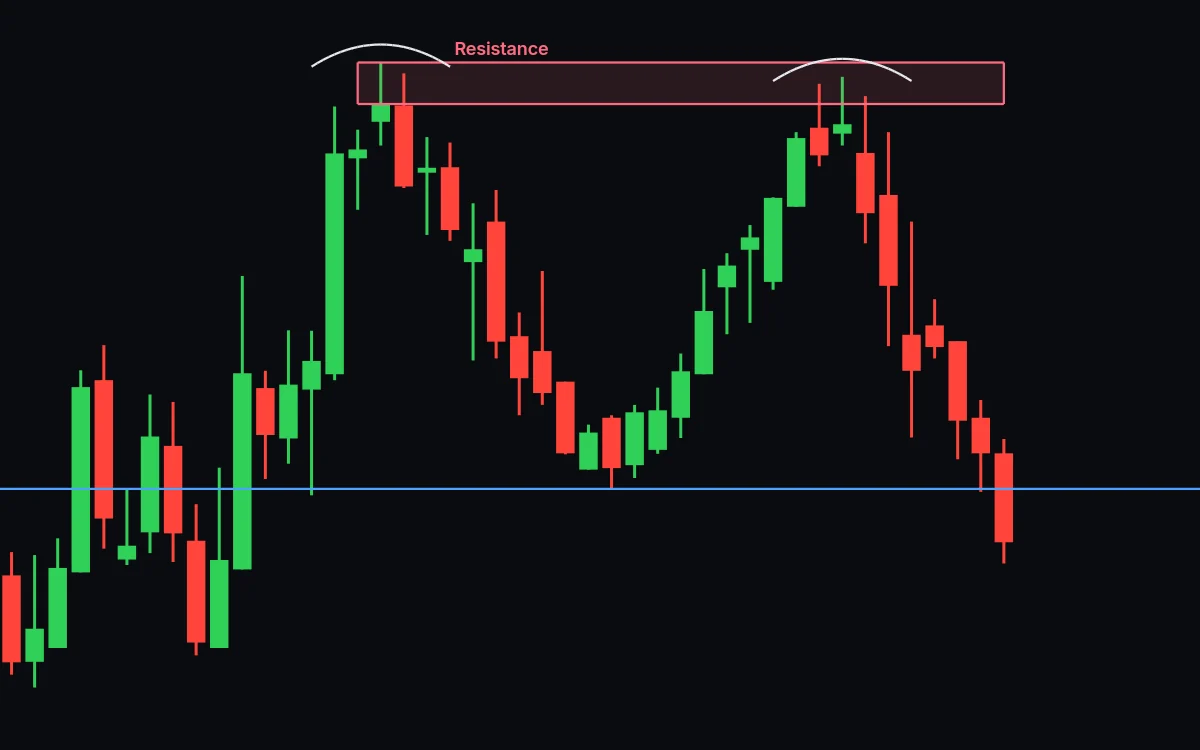
After the close below the line, traders call it a double top.
What is a retest?
A retest is the price coming back to the line after the break. On the lesson's first chart, the price climbed back up to the line from below a few days after the close.
The line held.
The line that had held the price up before now pushed it back down. The support and resistance lessons call this support becoming resistance.
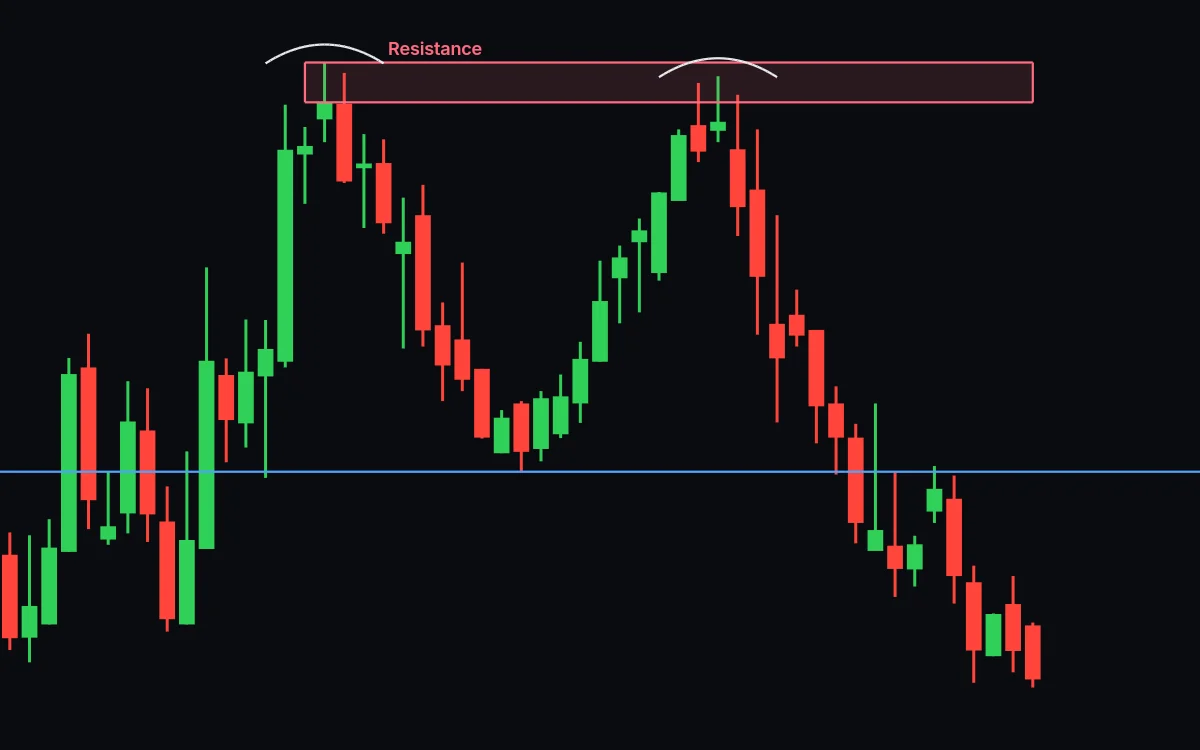
Some traders sell short on that first close under the line. Others wait for a retest like this one, hoping for a better risk to reward.
The price does not always come back to give them that retest.
What is a double bottom?
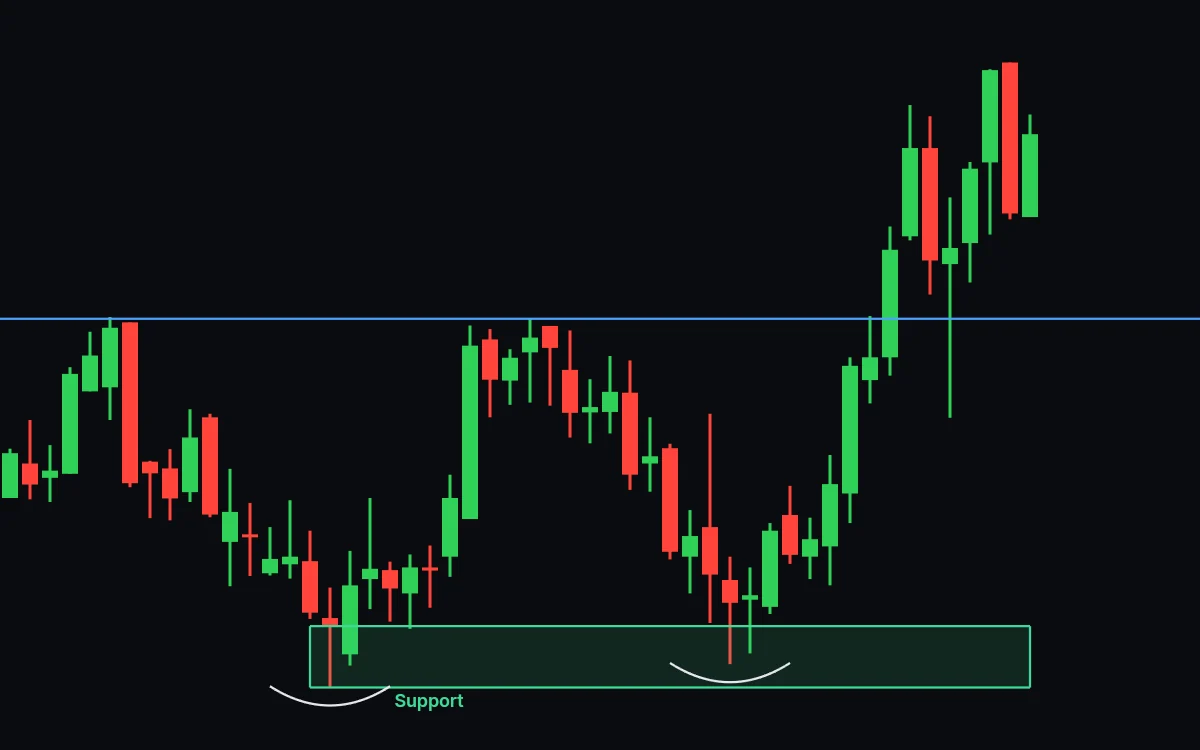
A double bottom is a double top turned upside down. The price falls, bounces, falls back to about the same low and bounces again.
| Double top | Double bottom | |
|---|---|---|
| Forms after | A rise | A fall |
| Zone | The first top's highest body to the tip of its wick | The first bottom's lowest body to the tip of its wick |
| Line | The lowest point between the two tops | The highest point between the two bottoms |
| Confirmed by | A close below the line | A close above the line |
The lesson's second chart has you draw the line yourself. A candle closed above it. The price kept climbing.
What happens when a double top never confirms?
The price can turn back up before any candle closes below the line. Then the two tops were never a double top.
The lesson's last chart has two tops in one zone with the line drawn underneath. The price comes back down to the line and holds.
Then it turns up and closes above both tops.
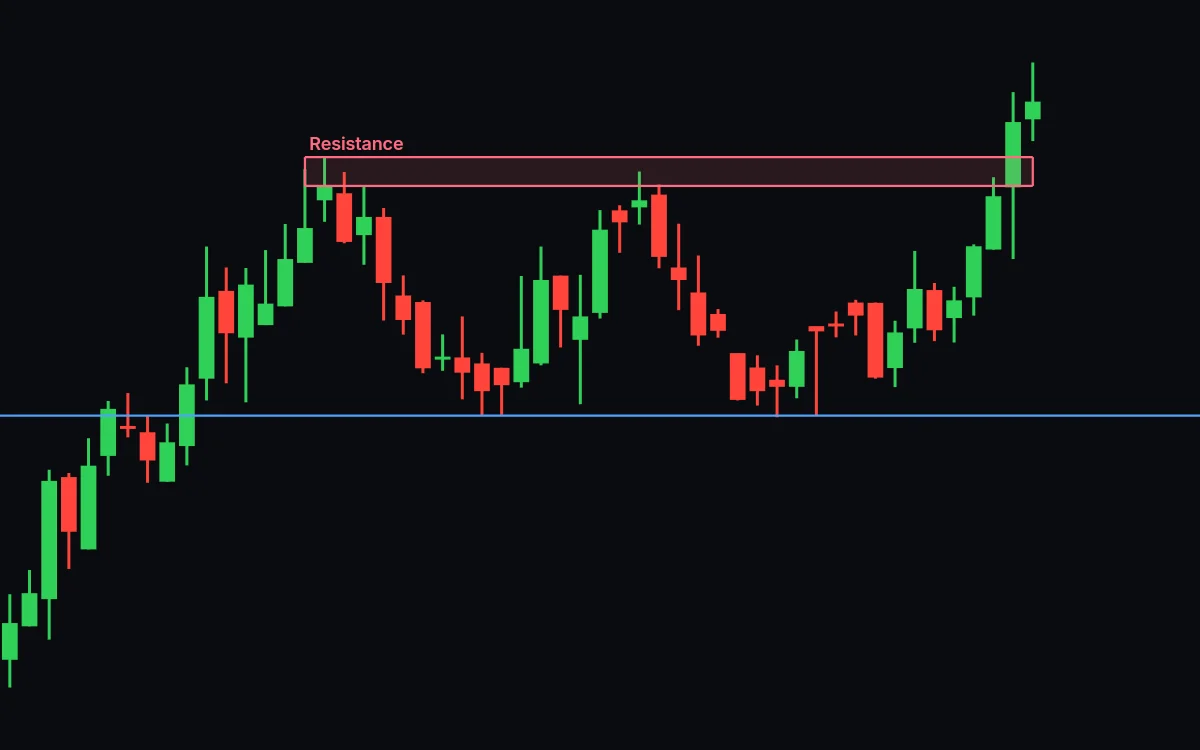
A trader who sold short on the second top would have been wrong on that chart. A trader waiting for the close never got a signal.
A confirmed double top can fail too. A close below the line can be followed by a close back above it, a false break.
Key points
- A double top is two highs in one zone with a dip between them. The line is the lowest point of the dip.
- It stays a potential double top until a candle closes below the line. A wick does not count.
- After the break, the price sometimes comes back to test the line from below.
- A double bottom mirrors it: two lows in one zone, confirmed by a close above the highest point between them.
- Any pattern can fail, before the close or after it.
Press Start above and draw the first top's zone. The next lesson, head and shoulders, waits on a close below its neckline the same way. The chart patterns page lists the other shapes and the line each one waits on.